
The Energy White Paper 2012 (EWP2012), released by the Australian Government last week, seeks to map out a strategic policy framework for future energy supply. One of the major goals of EWP2012 is to provide a “clear vision” of how Australia should set about the long-term task of decarbonising our stationary electricity, liquid fuels and industrial sectors.
So how well does it succeed?
As an overview of the current status quo on domestic supply, distribution and exports of energy, it is a fine document. However, as a forward-looking, agenda-setting stimulus paper, it has weaknesses.
The focus is strongly on how natural gas and unconventional fossil fuel markets might develop in the coming decades under various uncertainties, and the impact of these on national economic growth and trade.
In terms of its projections of the expansion of currently poorly developed “alternative” (non-fossil) electricity – the biggest issue to address – let’s consider the medium-demand scenario (Fig. 6.1, pg 88):
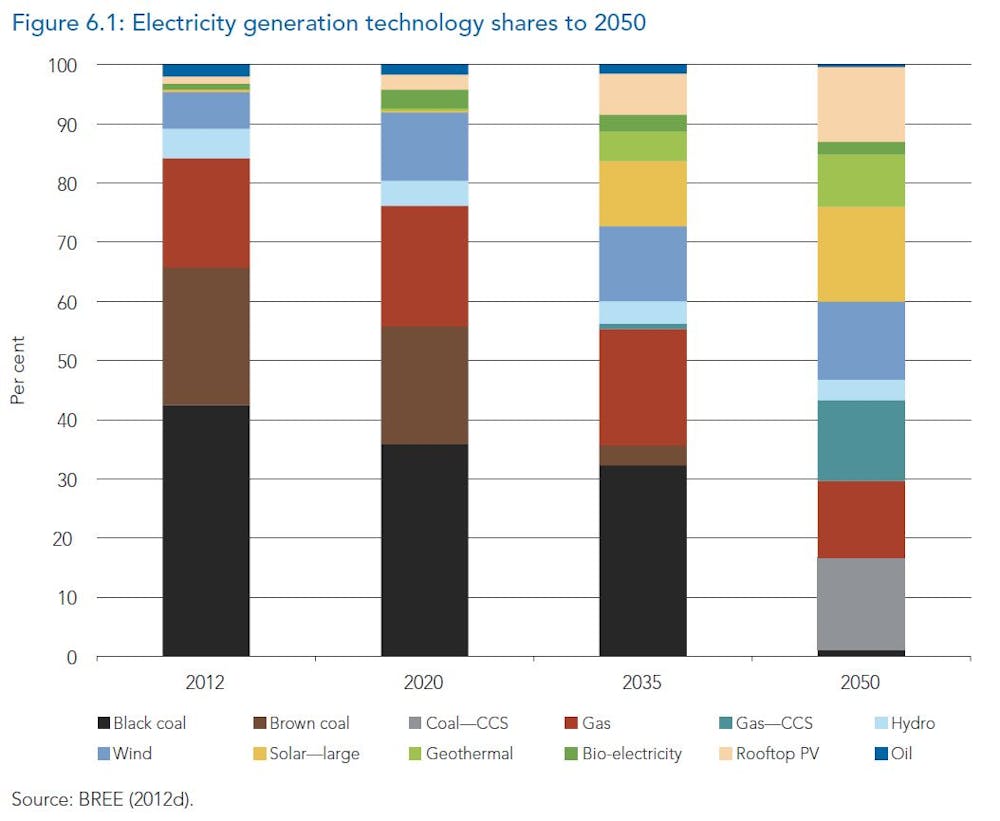
This shows a gradual phase out of traditional coal (to be replaced by carbon-capture and storage [CCS] variants after about 2035) and a ramp-up of combined cycle gas (both CCS and non-CCS). Up to half of electricity is coming from wind, solar thermal, solar PV and engineered geothermal by 2050. The estimated cost is “more than $200 billion in new generation investment”.
These projected finances are based on the levelised cost of electricity estimates provided in the recent AETA report, but do not adequately consider “value” of the electricity, as I explained here. Putting that to one side, the basic technology options, with current and projected 2030 prices, are shown in Fig. 6.2:
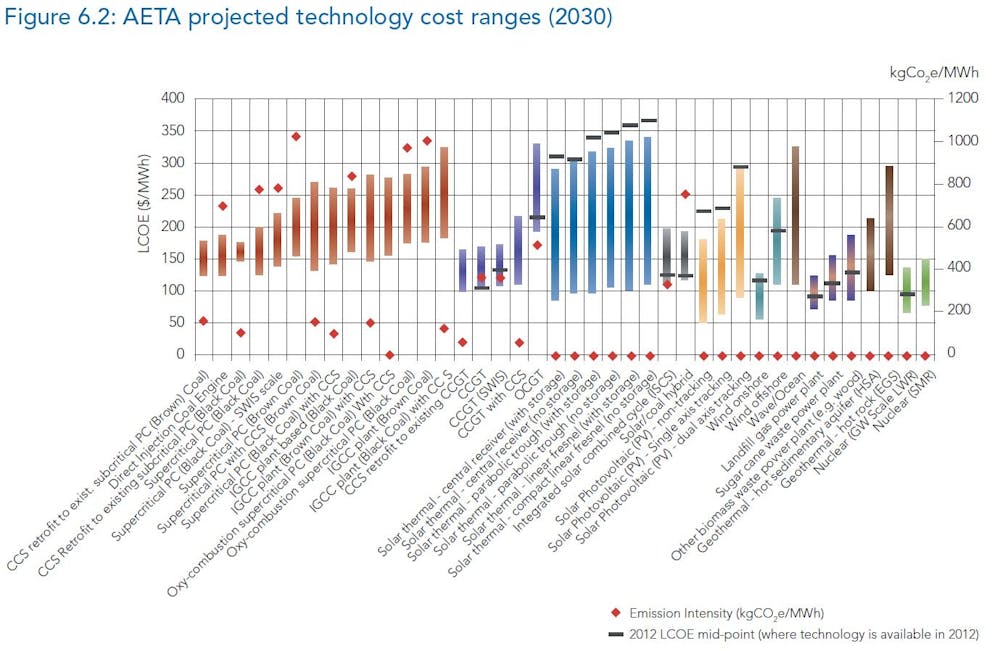
Nuclear power – generated by both large (“monolithic”) and small (“modular”) reactors – are an obvious low-cost, low-carbon (and baseload) standout here in Fig. 6.2. Yet nuclear power is invisible in the Fig. 6.1 projections.
Why? This is explained in Box 6.3 on pg 98 of EWP2012. The argument made is that there is no “social consensus” on the technology (is there one for coal-seam gas?), nor an economic case (but that is relative to its direct competitor, black and brown coal, with no carbon price).
So, in fact, nuclear doesn’t appear in the future modelling race because it’s not allowed up to the starting gate. This is not the case for any other energy source. Note that Box 6.3 does leave the door ajar for “future governments” to consider nuclear if other low-carbon technologies fail to achieve desired emissions cuts, and also notes that a decision to fission should be made by around 2020 if the first significant nuclear generators are to be plugged into the grid by 2030.
Other than a fleeting reference here or there regarding international forecasts of electricity use and uranium mining, that’s the only real reference to nuclear fission across the 234-page EWP2012 report.
The trade-offs implicit in ignoring a viable low-carbon energy option can be underscored by undertaking a short tour of the excellent new CSIRO efuture tool that was released to accompany EWP2012.
This is a web-browser-based scenario builder, which is simple and intuitive to use, allows any interested person to “Explore scenarios around technology cost, electricity demand and fuel prices, and see how your choices impact Australia’s electricity costs, technology mix and carbon emissions through to 2050.”
There are a large number of possible combinations to try, but I’ll focus on one that combines:
an enhanced emphasis on energy efficiency and conservation (low demand)
projections of future rising prices of fossil fuels due to potential shortages or supply bottlenecks (high fuel price)
inclusion of all technologies with a high-cost scenario to allow for a potentially diverse mix of supply
storage backup
crucially, a “yes” answer to “nuclear permitted”.
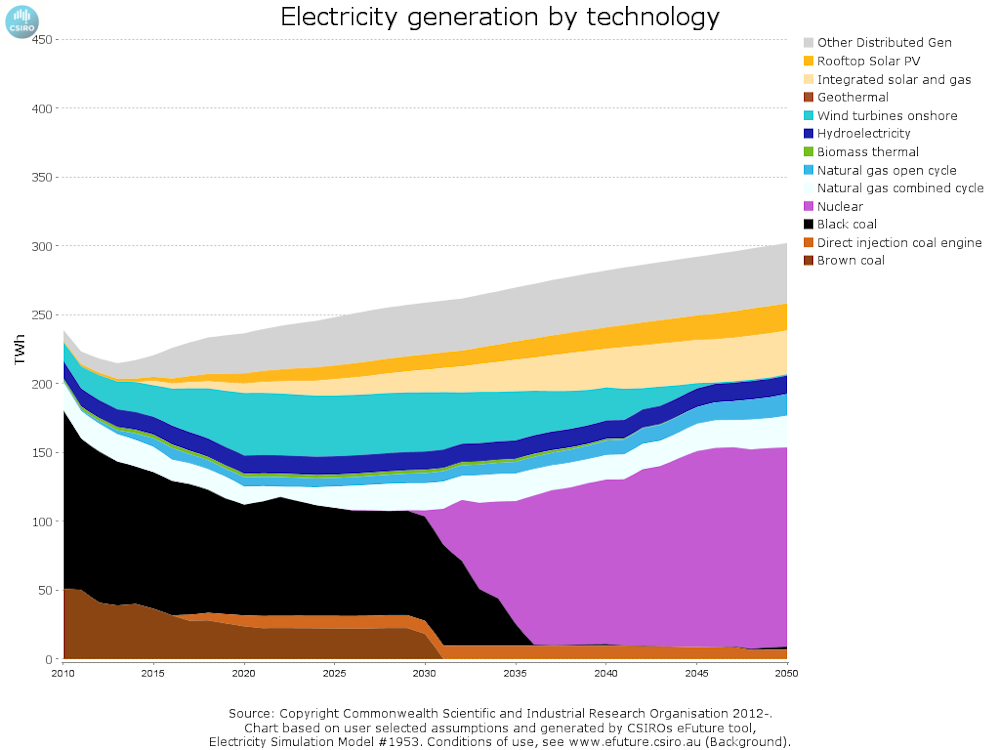
The electricity time series looks like this:
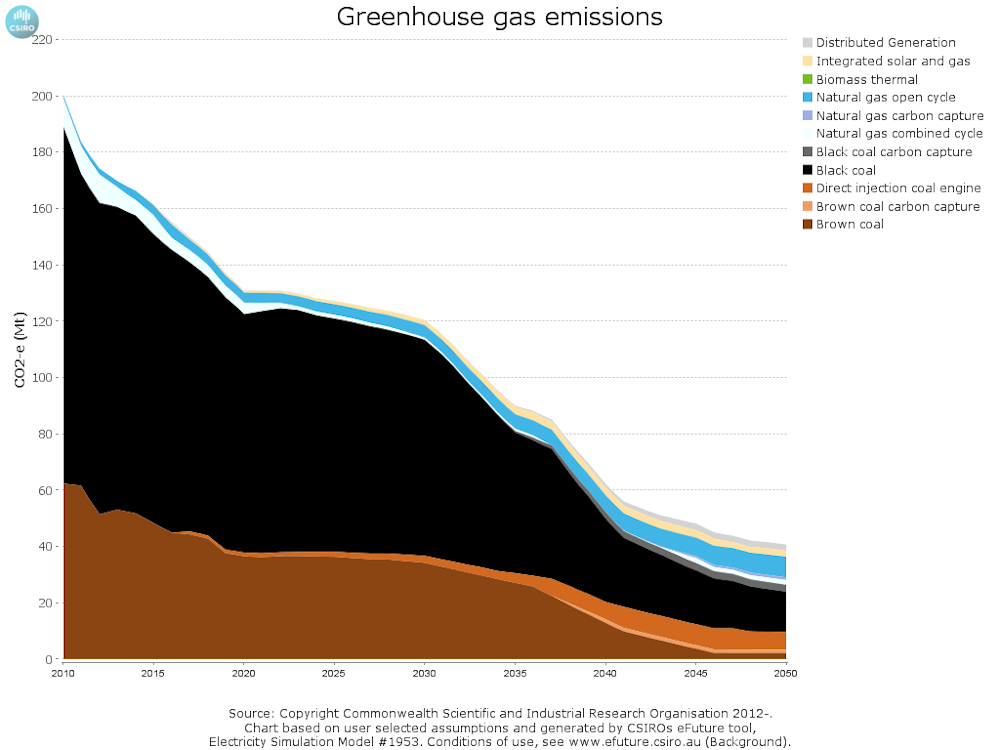
… and the resulting greenhouse-gas emissions profile is as follows:
In this nuclear-powered crystal ball, fission energy starts to grow seriously after about 2030, and by mid-century it constitutes a little under half of Australia’s electricity supply. Gas is held steady at a relatively low level, coal and wind are largely displaced, and grid-scale and distributed solar generation continues to grow.
Greenhouse-gas emissions are slashed by 90%, with most of emissions coming from gas plants used to meet peak demand.
In addition, I should point out that if nuclear is permitted, the general balance of electricity generation technologies that results is insensitive to selections on fuel prices, demand levels, storage choices, and so on. Try it. In modeller’s jargon, we’d say the conclusion that nuclear ought (by the numbers) to play a big role in decarbonising Australia’s future economy is robust to parameter uncertainty … if it is allowed.
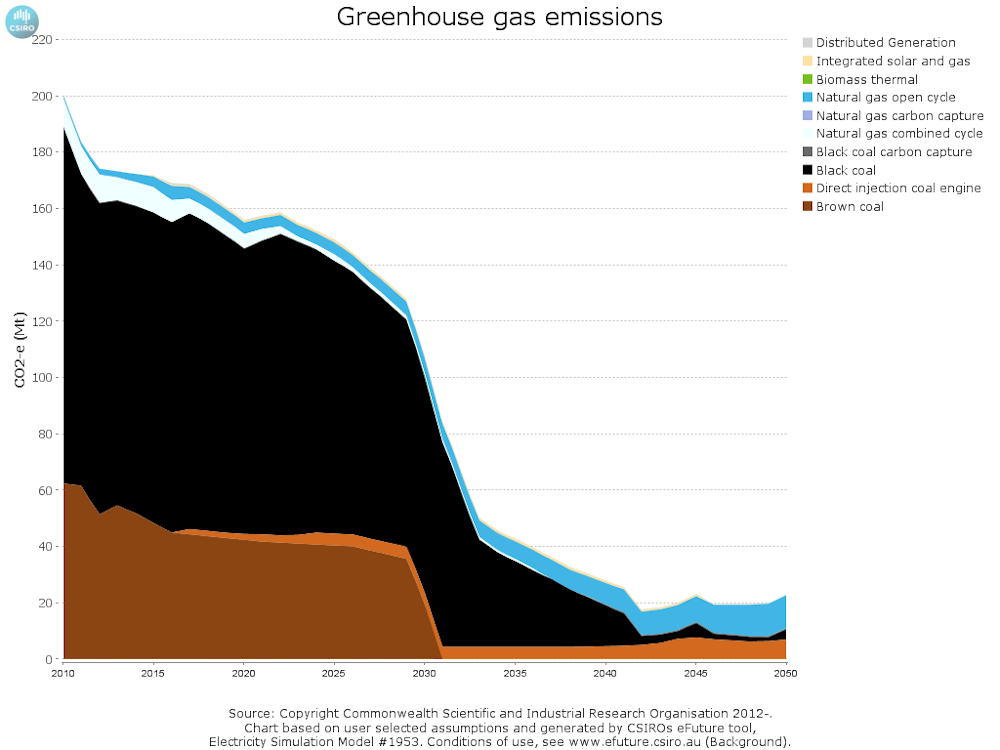
Finally, for a point of comparison, here are the greenhouse-gas emission reductions achieved with the efuture tool, for the same scenario as above. The only difference is in this case, nuclear remains forbidden:
In this case the 2050 emissions are acceptably low, although still almost double that under the nuclear-allowed scenario. To achieve this outcome, there will need to be a far greater reliance on carbon capture and storage to do the job (around a third of total supply). This is unlikely to appeal to most environmentalists.
The estimated cost for this scenario is about $150 per megawatt hour (wholesale), compared to $110 per megawatt hour when nuclear is permitted for otherwise the same modelling selections.
We can each draw our own conclusions from this scenario building. That is a great thing about modelling of alternatives, where the user is given flexibility – trade-offs can be made explicit and transparent.
For me, the overriding message is this: nuclear plus renewables equals cost-effective decarbonisation. Excluding nuclear means higher greenhouse-gas emissions, higher cost, and more fossil fuels with CCS.