
Amidst all the heat and noise of the Rio+20 Conference on Sustainable Development, the release of WWF’s Ecological Footprint analysis for Australia in May went largely unheralded in the general media. The Environment Minister’s media spinner would like this analysis. Headlines would trumpet: “Ecological Footprint Plummets and My Government’s Policies Gain Traction”
Well, it’s true that there has been a small drop from the last world census in 2010: 6.7 hectares per person now, down from 6.8 h/pp two years ago. We rank seventh highest globally behind Qatar, Kuwait, UAE, Denmark, the US, and Belgium, and followed closely by Canada, Netherlands, and Ireland. The three leading countries are odd bods, exporting only oil and gas and flashing credit cards in fancy shopping malls.
Australia’s vast size must be taken into account
In a gross sense, Australia’s overall footprint account keeps us in the credit side because our continental land mass provides another free lunch: a biocapacity of 14.6 h/pp says numerically there’s nearly 8 h/pp spare. Biocapacity is the area multiplied by the above ground biological productivity. This is adjusted or normalised to a “global hectare” basis to enable comparison between arid rangelands in Australia or the Sahel band across North Africa, and tropical rainforests in the Congo. On a “global hectare” basis the globe has a total of 335 million global hectares, or 43% of its physical land mass.
The biocapacity ranking gives us some eclectic bedfellows. We rank fifth behind Gabon, Bolivia, Mongolia, and Canada, and just ahead of Congo, Finland, Paraguay, New Zealand and Uruguay. So when the next “Australia Unlimited” conference of population boosters promotes a right-sized population of 100 million, perhaps they need to risk-manage this number a bit by putting at least 70 million into those countries with an equal or better biocapacity.
We need a rapid decarbonisation of the economy
Over 40% of Australia’s footprint is allocated to carbon land: actively growing forest that soaks up the carbon dioxide from our energy use. Somewhere our current 23 million people require 62 million hectares of carbon land to be acquired, measured and verified for carbon uptake and trading. The Government’s clean energy plan does little to substantially reduce carbon volumes from our energy over the 50 year policy timeline (see Chart 5.2 here).
Hypothetically the plan sources carbon land overseas in tropical developing countries, without much idea on where or whether it might be available on a long-term and trustworthy basis. This WWF footprint has 17% for animal products and 24% for cereals, fruits and vegetables. Built-up land represents less than 1%, emphasising that most of our impact is well out of suburban view, and city densification policies are a distraction in total impact terms. Thus, rapid decarbonisation of our economic structure (changing to low carbon energy sources) is the most important path to reducing our footprint.
Much of the Rio+20 debate centred on equity - the right of each global citizen to use and pollute on a equal basis. The footprint parlance tells us that if the world’s citizens consumed like Australians, we’d require 3.76 planets (or the biocapacity of them, anyway). We survive that reality today by eating through our capital: stocks of wood, fish, farmland, and fossil fuels. Through more efficient technologies we could do better with less. However, population growth and economic growth always outpace the technology game and we continue to use more natural capital than we refurbish.
Calculating biocapacity
Commentators and scientists alike criticise the footprint metaphor on two grounds. Generally they don’t like counting apples and oranges into the same basket. However many synthetic indexes do that. The UN’s Human Development Index combines longevity, schooling, and income into a simple way to rank a nation’s development. Secondly, critics don’t like the use of carbon land (40% of Australia’s footprint) because it is not implemented in current land-use policy. However, much of Australia’s low-carbon transition is predicated on doing nothing at home and buying sequestration land in neighbouring tropical countries. Most importantly, the concept of biocapacity (implemented in technical form as “the human appropriation of net primary production” (HANPP), is increasingly accepted as a singular measurement of global un-sustainability. Thus the footprint and its numeracy has wide and deep science underpinnings.
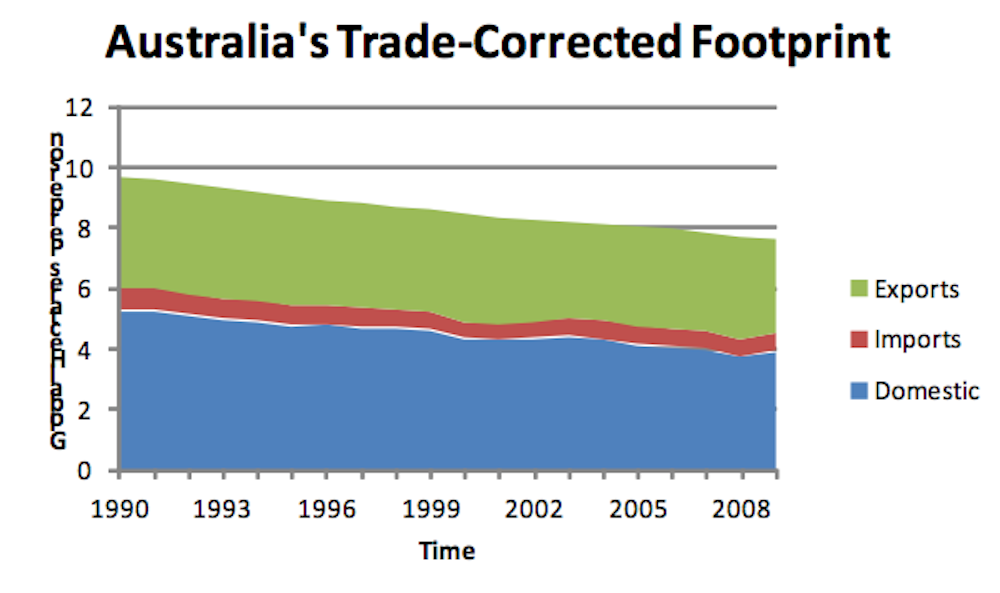
A different nuance to Australia’s footprint is the “trade corrected” measure since 1990 provided by the Eora global model that gave the recent “trade and biodiversity” analysis presented in The Conversation (see figure below). Apart from a steady decline since 1990 (from “exceptionally wasteful” to just wasteful), the trade view reveals that our purely domestic impact is about 4.5 h/pp and exports make up the rest (a same-basis calculation of the WWF and this trade corrected footprints are within 3%). “Trade corrected” accounting should book the extra three hectares to our trading partners. Then we could sleep better at night knowing we only require two and a half worlds to keep the shopping party going. More worrying though is the ratio of our exports-footprint to our imports footprint (the footprint of the manufacturing/producing and shipping from origin to Australia) abroad, which is more than five to one. Thus our relatively unsophisticated “farm and quarry” economy needs many more global hectares used at home to balance our imports. Even then we run a protracted balance of payments deficit in dollar terms for what are a raft of physical transactions.
Beyond footprints though, WWF’s Living Planet Report gives a compelling overview of the global environmental challenge. If only our government State of Environment reports could provide the integrated science overview and plain speaking that “Living Planet” provides.
Temperate biodiversity faring much better than tropical
Its summation of plant and animal biodiversity, the Global Living Planet Index, has declined 28% over the last 38 years with temperate systems (+31%) doing much better than tropical systems (-61%). The marine index is down 22% with a similar pattern of temperate doing better (+53%) than tropical (-62%). Blue water resources (dammed or managed water) accounts for 11% of humanity’s water-churn, and managed water use is one billion gigalitres (that’s about 330,000 Lake Hume storages when 100% full). Of the 405 big river basins assessed, Australia’s water policy traumas in the Murray Darling Basin are displayed prominently on global maps, so our basin angst goes well beyond our river-dependent towns.
What happens now?
So what to do with all this environmental misery? This is when I turn to the sporting page where there’s always good news in the recovery from a niggling groin injury or the bionic replacement of a cruciate ligament.
Once again, the Living Planet Report has a neat summation of national and global options into five areas: (1) Preserve natural capital (2) Produce better, (3) Consume more wisely (4) Redirect financial flows and (5) Equitable resource governance. If that’s all a bit too NGO for you, I’ve been following the Corporation 20/20 discussions led by Pavan Sukhdev, the merchant banker turned biodiversity tragic who oversaw The Economics of Ecosystems and Biodiversity (TEEB) study, a multi-partner global project. There’s a remarkable resonance, so perhaps we are moving in the right direction.
Comments welcome below.