

News of significant job losses and organisational restructuring at Fairfax has thrown new spotlight onto the continuing transformation of the Australian media landscape.
It’s clear that newspapers in their traditional form are approaching a point of no return, as news consumption habits are changing for good.
It’s all too easy to blame (or praise) the internet for this transformation of the media landscape; the simple fact is that it now plays an important role as a medium through which news is accessed and shared by the general public.
One side effect of this shift is that traditional metrics for tracking the market share and influence of media companies no longer provide the full picture. Newspaper circulation figures are no longer a relevant or reliable metric (if they ever were).
But what measures of importance are really available to us in the online space? Particularly when news is now distributed across a variety of platforms from aggregators like Google News and Flipboard to social media channels such as Facebook and Twitter?
Indeed, how do we understand “importance” in this context - is it important for a website simply to attract visitors, or should we also take into account how those visitors react to what they encounter, for example by sharing links to the content through their own social networks?
New measures
Only a very limited amount of independently verified information is available on how Australian news websites perform in this context; what internal click-through data they may gather is rarely available to the general public.
To add to the mix, and to generate a reliable, comparative index of the resonance for the major Australian online news and commentary sites, my colleagues and I at the ARC Centre of Excellence for Creative Industries and Innovation at Queensland University of Technology have developed a tool which tracks the circulation of links to these sites on the social media platform Twitter.
Day by day, we track all tweets which contain links to any of the country’s leading national and regional news sites, as well as to the various opinion and commentary sites such as Crikey and The Conversation; we capture those tweets even if the original link has been converted into a short URL (using bit.ly, t.co, or any other shortening service).
The only tweets we are unable to capture at this point are “button” retweets, but we do track “manual” retweets (e.g. “RT @user …”), which serve as a reasonable basis for extrapolation.
Counting these links for each of the sites is a measure half-way between newspaper circulation figures and TV ratings: link circulation figures on Twitter don’t simply indicate the size of these sites’ audiences (as paper circulations do), but also point to readers’ levels of engagement with the content they encounter (as TV ratings can). It’s one thing to read a story on a news Website - it’s another to go to the trouble of sharing it with your social media followers.
A measure of engagement
As with print circulations and TV ratings, though, there remains room for interpretation here, too: what users share and what they read may diverge to some extent. As a professional on Twitter, for example, I may not want to let my followers know about all the sports news I read; conversely, I may pass on links to stories which I haven’t read fully (or at all) myself, just because they sound interesting.
But such margin of error exists in most ratings systems - the newspaper we buy to put under the cat’s litter tray still adds to The Sunday Mail’s circulation figures; the TV running while we make dinner still adds to the ratings for ABC News.
What’s unique about our Twitter news circulation index, though, is that it’s neither based on simple sales figures (like print circulations), nor on an extrapolation from the media consumption patterns of a small number of more or less representative households (like ratings).
Rather, apart from “button” retweets, we capture all tweets that contain links to Australian news and opinion sites - that is, we track active, visible, deliberate engagement with Australian news content.
18-25 June 2012
The first weeks of this Australian Twitter News Index (ATNIX) were momentous for the Australian media industry, of course; Fairfax announced some major job cuts, and News Ltd revealed plans to follow suit.
This may well have boosted the circulation of links to Australian news sites on Twitter - and especially perhaps to Fairfax properties themselves. Over the course of the week from 18 to 25 June, we captured some 150,000 tweets:
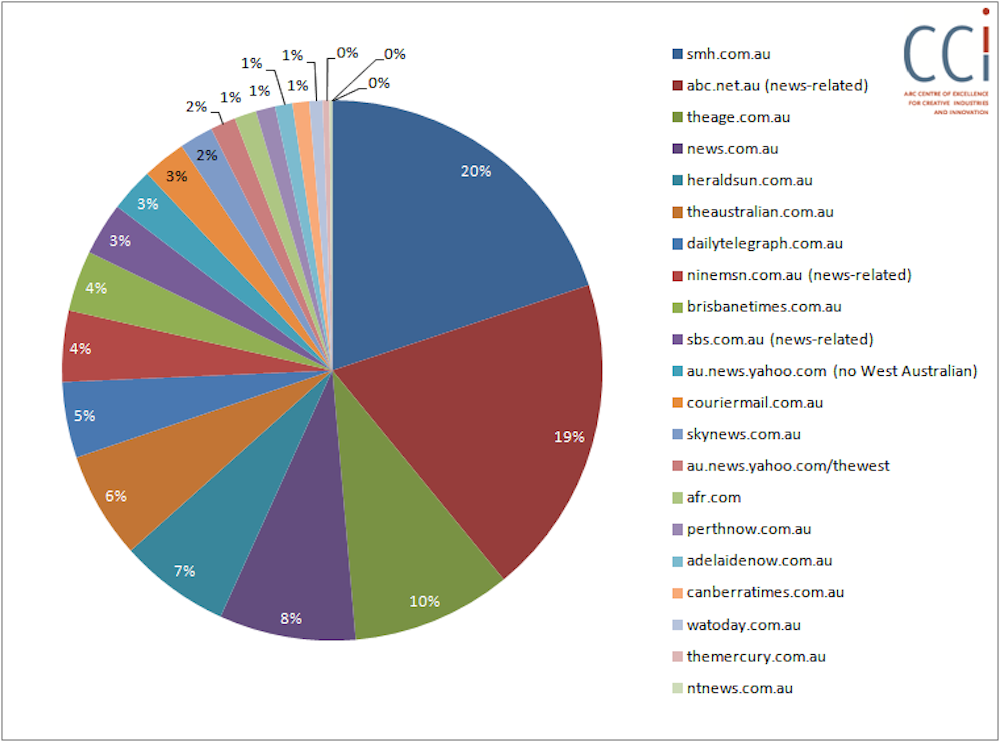
In a week of bad news for Fairfax, that’s a very strong result for its two major sites, the Sydney Morning Herald and The Age. The marketshare of News Ltd sites is also interesting: individually, these sites don’t command positions as prominent as those of the two leading Fairfax papers, but in combination, the four top News Ltd sites news.com.au, The Australian, The Herald Sun, The Daily Telegraph still account for almost exactly 25% of the news links shared.
Finally, I’m also somewhat surprised that Fairfax’s online-only news site Brisbane Times outperformed its local News Ltd rival, the print-and-online Courier-Mail, by some 900 tweets – although it remains to be seen how much of this is due to the news about Fairfax itself this past week. If it is able to hold its own against the long-established News title, though, that would be an indication that Fairfax’s future “digital first” strategy can indeed work, at least in the absence of a paywall.
(And a quick note on the ABC and SBS figures: we’re counting only links to broadly news-related sections of these sites here - clearly, both public broadcasters’ sites cover a lot more than the news alone.)
Let’s also have a look at the attention share of opinion and commentary sites, then:
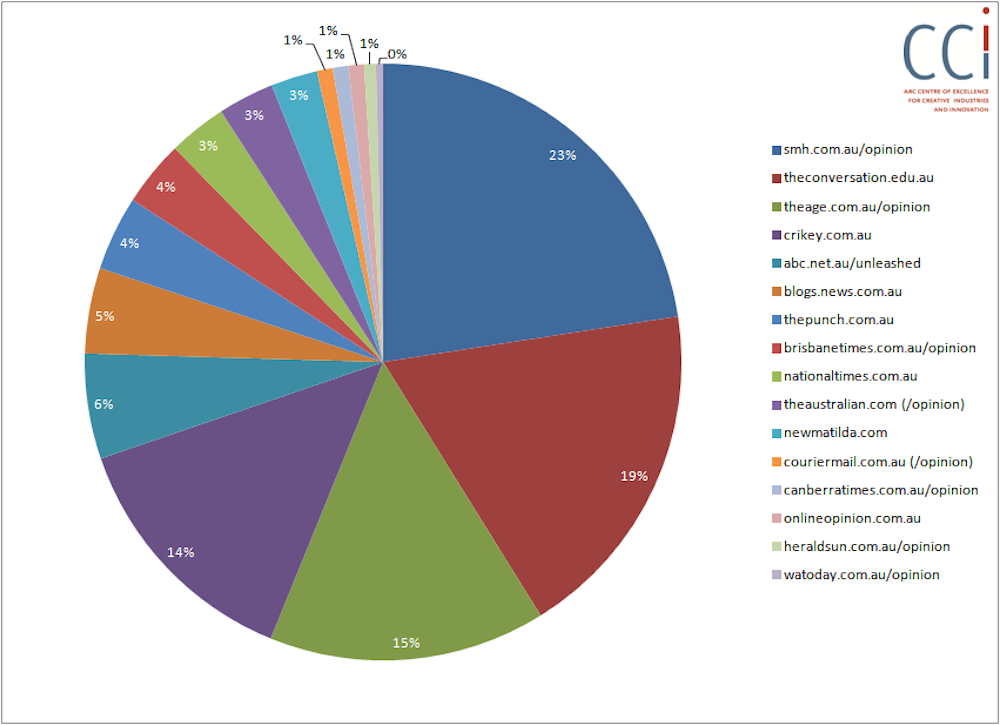
Here, too, the opinion pages of Sydney Morning Herald and The Age play a significant role - but The Conversation also put in a remarkable performance that week. This, too, is due in good part to the Fairfax upheavals – stories addressing the job cuts at Fairfax and their impact on the Australian media (including an article by former Prime Minister Malcolm Fraser) accounted for a very significant chunk of the Conversation links being shared on Twitter that week.
Crikey and the ABC site The Drum round out the leading sites, which together account for more than three quarters of the opinion and commentary links in our dataset. (Note, though, that URLs for The Drum are difficult to detect comprehensively, because of how they are formatted; we may well be undercounting The Drum, therefore.)
26 June - 1 July
The following week was a slightly slower news week – we tracked some 140,000 tweets containing URLs, compared to over 150,000 the previous week. Here’s now the mainstream news sites compared:
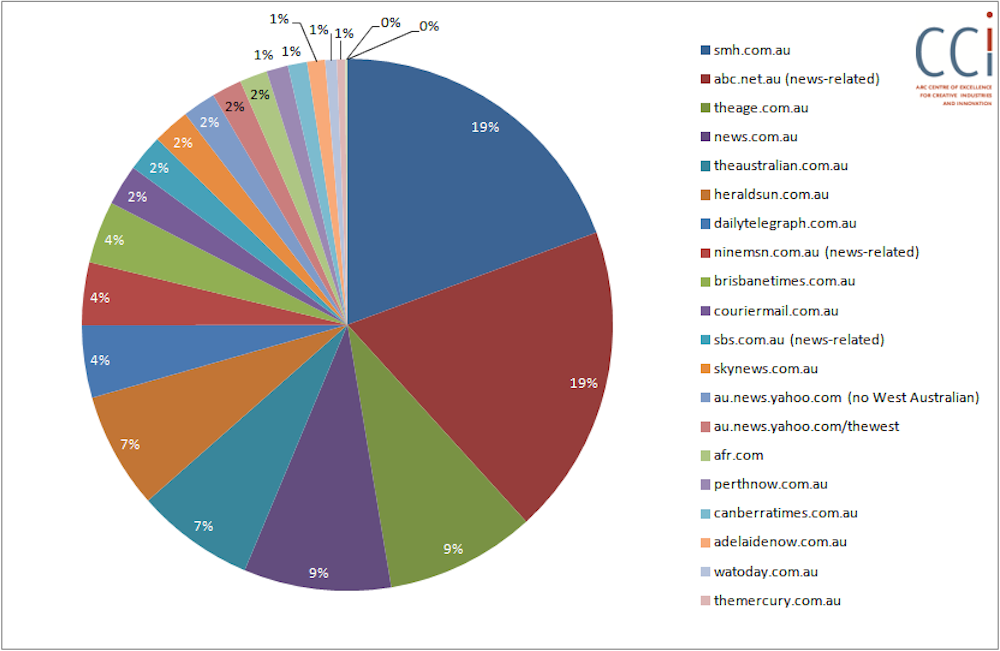
No great changes from the previous week. The Australian overtakes the Herald Sun, and there is some reshuffling of the minor places. But at the top of the leaderboard, placings and proportions of marketshare remain remarkably stable.
Could this be a sign that – for all the talk that social media (and aggregators like Google News) are “cannibalising” masthead sites – there still is considerable brand loyalty amongst those who read (and share) the news? We’ll keep an eye on this.
On to the opinion and commentary sites:
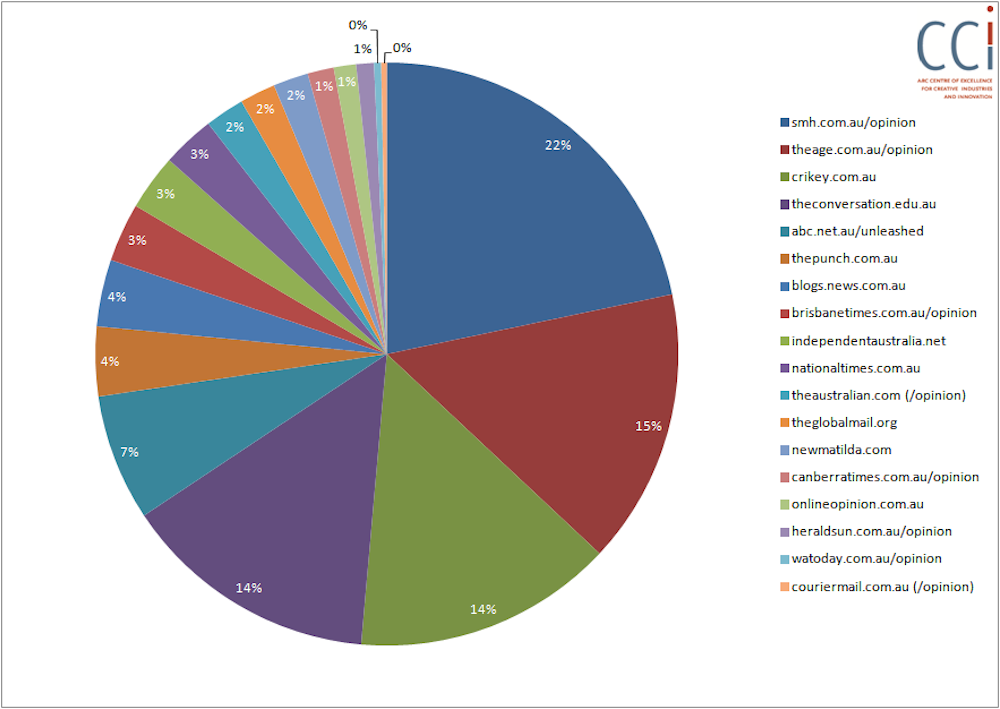
Here, too, the top of the leaderboard remains relatively stable, with one major exception: The Conversation falls back from second to fourth place, losing five percentage points in marketshare amongst the opinion sites. Note that the percentages of the other leading sites don’t vary much at all from the past week – it really is the dissipation of the Fairfax factor which accounts for The Conversation’s slide.
Starting point
These first weeks of ATNIX data point to some interesting patterns, but to what extent they were overshadowed by the events surrounding Fairfax remains to be seen.
Over the coming weeks and months, as we see a picture emerge of the Twitter link circulation marketshare for major Australian news sites, it will be worth it to further reflect on what these figures mean.
Clearly, we cannot assume that these observations translate straightforwardly into an indication of hits on these sites – the Twitter userbase is too unrepresentative of the wider Australian population for this.
In future, we hope to connect and compare these ATNIX metrics with other information available to us, to generate an even more comprehensive picture - to begin with, perhaps, with the number of followers each sharing user has: a link shared by a users with a few dozen followers will necessarily have less impact than one shared by a leading account in the Australian Twittersphere.
Read more at Axel Bruns’ column Social media and society