
A study of tree-ring data recently found that in some regions temperatures during Roman times (21AD to 50AD) were 1.05 degrees Celsius higher than the 1951-1980 mean.
The paper’s lead author, Professor Jan Esper of Johannes Gutenberg University in Mainz, Germany, and his colleagues [wrote that](Orbital forcing of tree-ring data](http://www.nature.com/nclimate/journal/vaop/ncurrent/full/nclimate1589.html): “large-scale near-surface air-temperature reconstructions relying on tree-ring data may underestimate pre-instrumental temperatures including warmth during Medieval and Roman times”.
Professor Esper was quoted in the press as saying:
We found that previous estimates of historical temperatures during the Roman era and the Middle Ages were too low.
This figure we calculated may not seem particularly significant, however it is not negligible when compared to global warming, which up to now has been less than 1 degree Celsius.
The study and the above comments have provided fuel for people who argue that that current warming is not related to anthropogenic carbon emission. Here is an example, and here is another.
The extent to which the regional high-latitude summer tree-ring temperature reconstructions by Esper et al reflect past mean global temperatures is debated. Michael Mann (director of the Earth System Science Center at Pennsylvania State University) argues that Esper’s tree-ring measurements come from high latitudes and reflect only summer temperatures, arguing that “the implications of this study are vastly overstated by the authors.”
According to the IPCC AR4 in 2007, late Holocene reconstructions of maximum temperatures during the Medieval Warming Period (MWP) have, in some areas, reached about 0.9 Celsius higher than mean global pre-industrial temperatures (Figure 1, from IPCC Figure 6.13), namely not all that different from Esper et al.’s 2012 estimates. However, the mean MWP temperature rise is about 0.3 – 0.5 degrees Celsius (see Figure 1), namely about half the 20th century rise of about 0.8 degrees Celsius, not even considering the additional 1.1 degrees C masked by sulphur aerosols (see below).
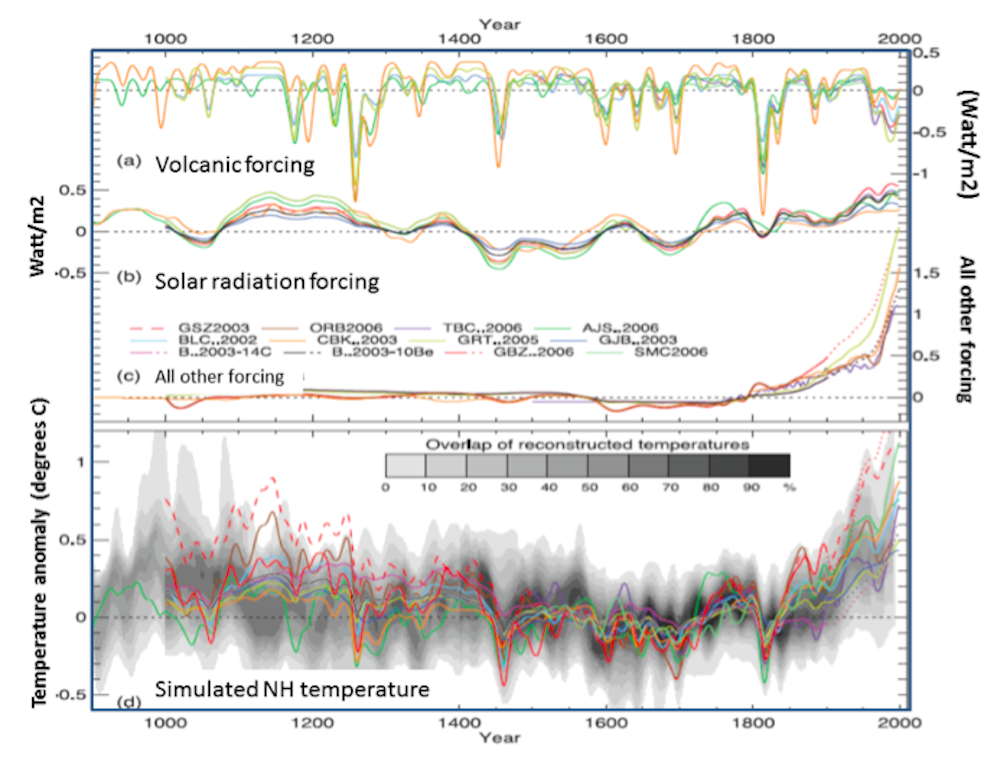
What are the implications of these regional high latitude temperature reconstructions regarding the role of insolation versus versus radiative forcings by greenhouse gases for post 18th Century climate change?
During the first half of the 20th Century, a rise in insolation levels was responsible for a temperature anomaly of approximately 0.3 degrees Celsius and has stabilized since the mid-20th century (Solanki 2002). Solanki, an authority in solar science, states: “Hence the Sun cannot be the dominant source of this latest temperature increase, with manmade greenhouse gases being the likely dominant alternative.”
Since the onset of the industrial age, a total anthropogenic carbon release of between 1750 to 2010 of about 540 billions tonnes of carbon (GtC) - from both industrial emission and land clearing - raised atmospheric carbon from ~590 to 820 GtC and CO2 levels from 275 to between 395.7 and 400 ppm.
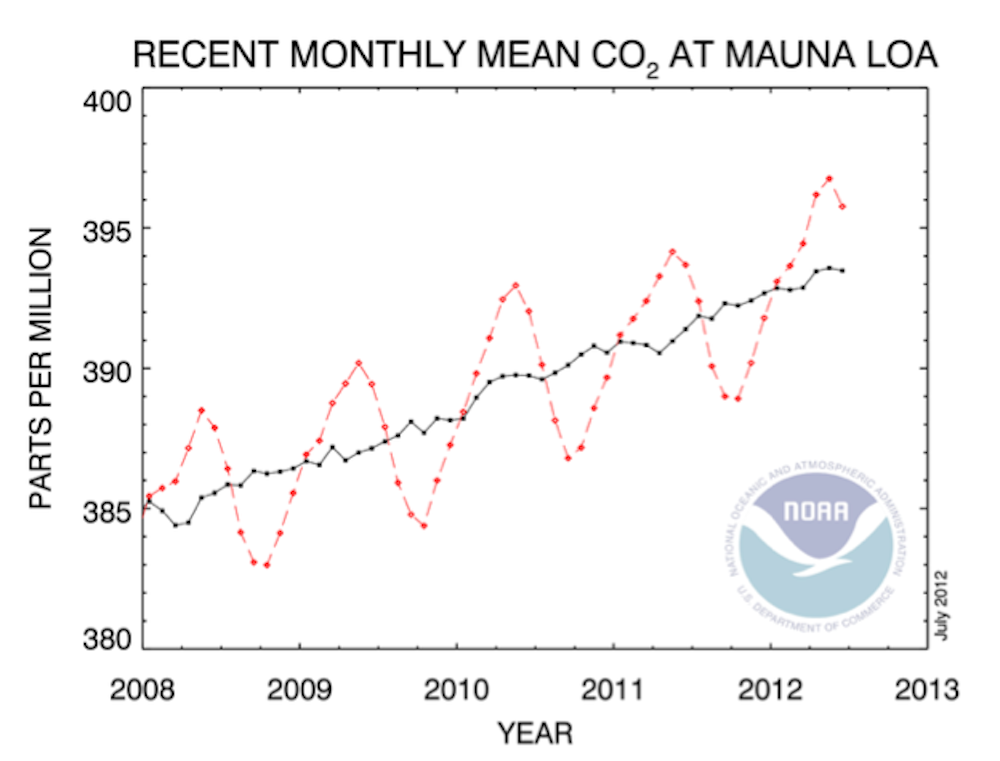
Current CO2 rise trends in ppm/year (2005 - 2.52; 2006 - 1.76; 2007 - 2.22; 2008 - 1.59; 2009 - 1.89; 2010 - 2.42; 2011 - 1.88 ppm/year) are the highest recorded in the Cainozoic (from 65 Ma) to the present.
Measurements taken last month at Mouna Loa at 395.77 ppm CO2 (Figure 2) and over the Arctic of 400 ppm, define new milestones in the rise of greenhouse gases (GHG) at levels not experienced since the Pliocene, (5.3 to 2.6 million years ago), a period during which mean global temperatures were 2 to 3 degrees Celsius and sea levels 25+/-12 meters higher than in the 18th century.
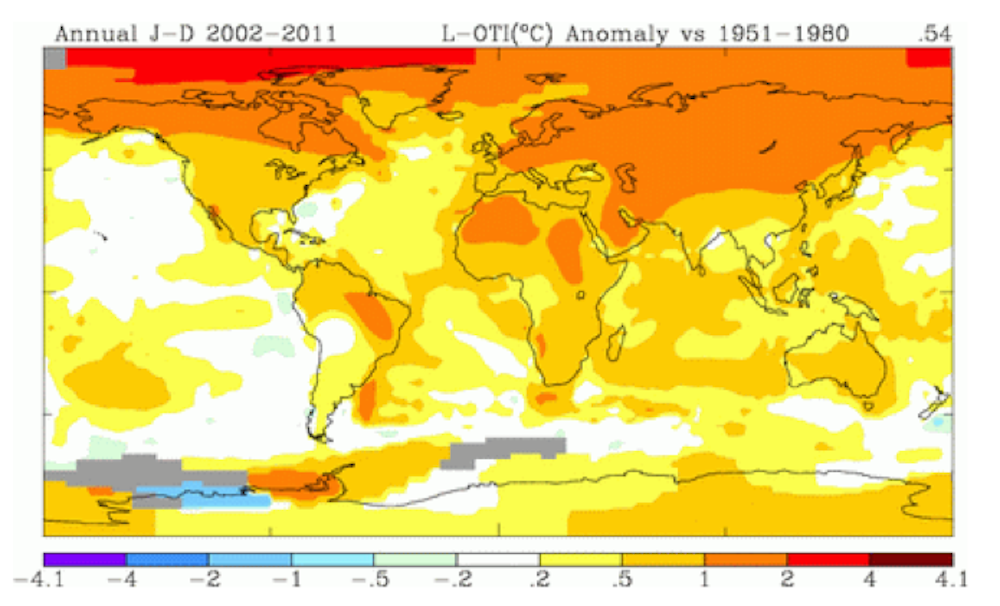
Mean global temperatures continued to rise (Figures 3 and 4), notably in polar and sub-polar latitudes and Greenland May-2012 temperature reached an all-time high of 24.8 degrees Celsius. The rise in temperature of about 0.8 degrees Celsius since 1880 is compounded by latent rise of approximately 1.1 degrees Celsius currently masked by industrially emitted sulphur oxide aerosols and sulphuric acid.
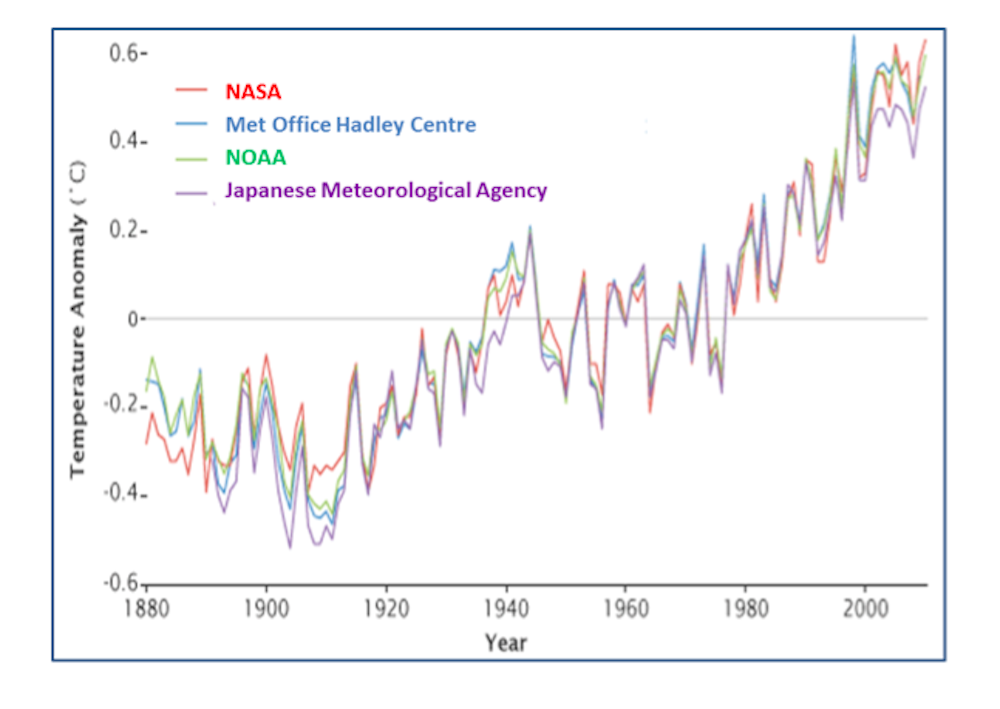
In accord with theoretical, laboratory experimental, paleoclimate proxies and direct measurements, the rising levels of greenhouse gases are shifting the energy state of the atmosphere beyond that which allowed the relatively stable climate conditions from about 10,000 years ago. Those stable conditions allowed the development of agriculture and civilization and minimizing the disruptive effect of extreme weather events such as have increased about the outset of the 21st century, as confirmed by Hadley, NOAA, CSIRO, BOM and other climate research organizations.
In summary, whereas both insolation and atmospheric greenhouse gas (GHG) levels constitute major climate drivers, during post-industrial times the rise in GHG (3.1 Watt/m2) has superseded the rise in insolation (<0.4 Watt/m2) by a factor of near 8, although about half the corresponding rise in temperature is masked by short-lived industrially emitted sulphur aerosols.
Comments welcome below.