
Three months into the brave new world of carbon pricing, and we can see some dramatic trends in the latest data from the National Electricity Market - or NEM. In particular, the latest data shows the demand for electricity is continuing to collapse in spectacular fashion.
In the 3 months since the carbon tax was introduced at beginning July, demand for electricity dispatched on the NEM is down some 600 megawatts compared to the equivalent period one year ago. It is now down 2000 megawatts on the record levels for the same period in 2008.
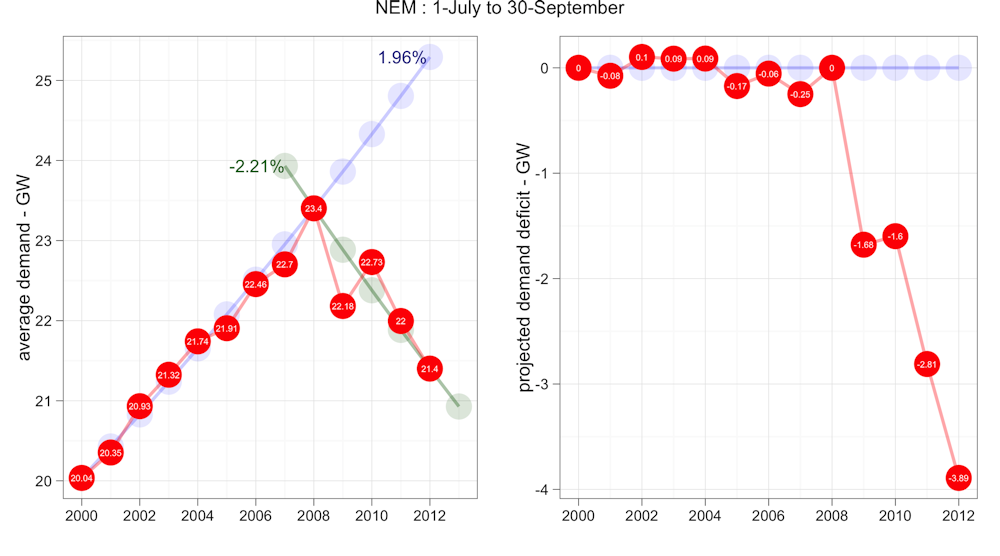
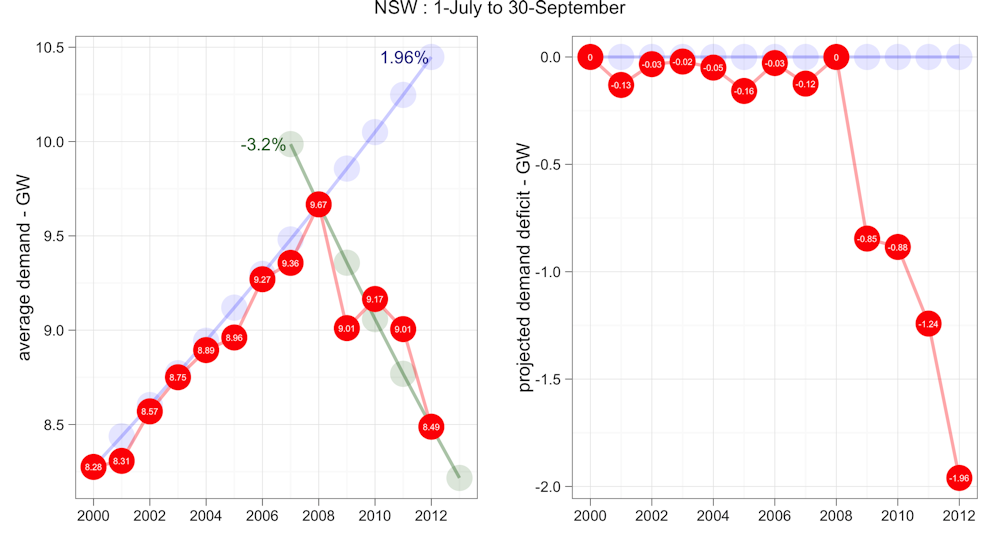
Amounting to a real reduction of about 9% over the four-year period, these are extraordinary changes. They must be deeply worrying the industry especially in NSW where the collapse in market demand is most profound.
Average demand in NSW for the last three months is down almost 500 megawatts on where it was just a year ago, and almost 1200 megawatts on 2008 levels. Continuing on its current trajectory of about -3.2% per annum, NSW winter demand will be down next year to levels not seen since the 1990’s. The impact is all the more significant because it is the winter months for which average demand for electricity is highest.
With planning for electricity generation investment needing long lead times, the magnitude of these changes are arguably better framed in terms of previous forward growth projections.
As recently as 2008 the utilities would have been banking on 2% per annum growth. Compared with that demand is now down almost 15%.
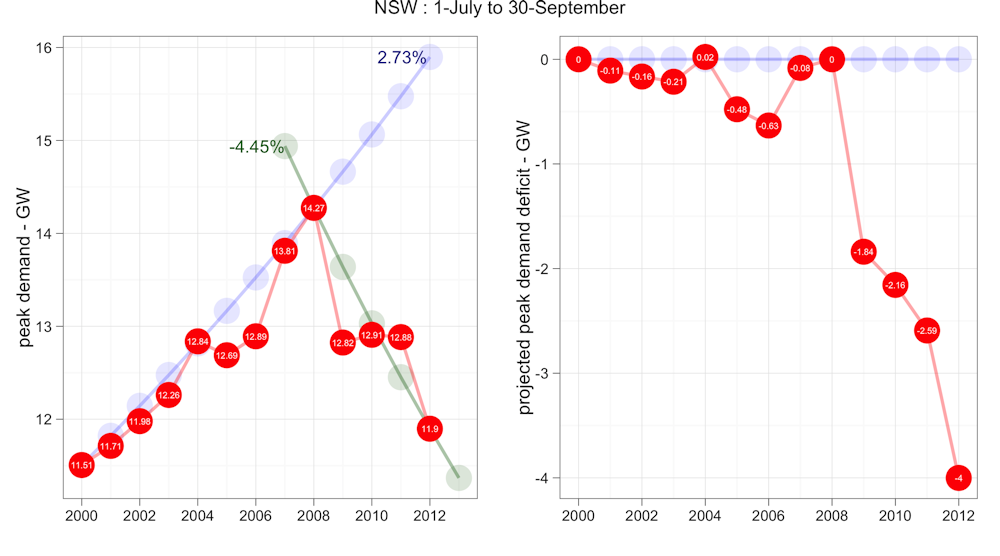
Interestingly, it is not just average demand that is down. NSW winter peak demand is down even more, having fallen an average of 4.5% per annum since 2008. Compared with the forward projections, winter peak demand is down a massive 25%. Across the NEM peak winter demand has been falling at 3.2% per annum since 2008, and is now down to levels not seen since 2003.
These are simply horrendous numbers for our electric power utilities who, until recently, have been discounting the downward trend in demand since 2008 as a temporary inconvenience. It seems now though that they maybe wakening to the awful prospect that demand for their prodcut may not return.
Anyone paying attention to national energy policy will have noticed how the established utilities seemed to have recently “upped the ante” in the national energy debate. A particular focus has been the federal government’s Renewable Energy Target (RET) that mandates that at least 20% of our electricity should come from renewable sources by 2020.
The industry beef is with the target. Instead of being framed in terms of 20% of plausible actual demand it was framed in terms of a total amount of electricity - nominally 45 thousand gigawatt hours or an average of about 5.2 gigawatts. That was an estimate based on a forward projection, already hopelessly out of kilter with reality.
With renewables contributing only about 2 gigawatts of our electricity demand, the prospect of adding another 3 gigawatts of mandated supply to the already saturated market is the stuff of nightmares for the owners of existing power generation assets.
And so with their industry under threat, incumbent utilities such as Origin, and TruEnergy are now taking every opportunity to lobby the government to water down the RET. Not suprisingly the [Australian Coal Industry’s Nikki Williams has come out swinging at the RET](http://www.theaustralian.com.au/national-affairs/opinion/please-get-rid-of-the-renewable-energy-target/story-e6frgd0x-1226476846604](http://www.theaustralian.com.au/national-affairs/opinion/please-get-rid-of-the-renewable-energy-target/story-e6frgd0x-1226476846604), with such ludicrous propositions as the “RET merely adds to the cost of achieving our abatement target rather than lowering our greenhouse emissions”.
Of course the challenge for industry and government alike is to understand where demand is headed over the next five to ten year period. And to do so requires an understanding of why demand is collapsing in such spectacular and unpredictable fashion, despite sustained GDP growth.
Many pundits have been blaming our recent spate of cool summers as key factor in demand reduction, but that clearly cannot be relevant to plummeting winter demand.
So there must be other much more important factors.
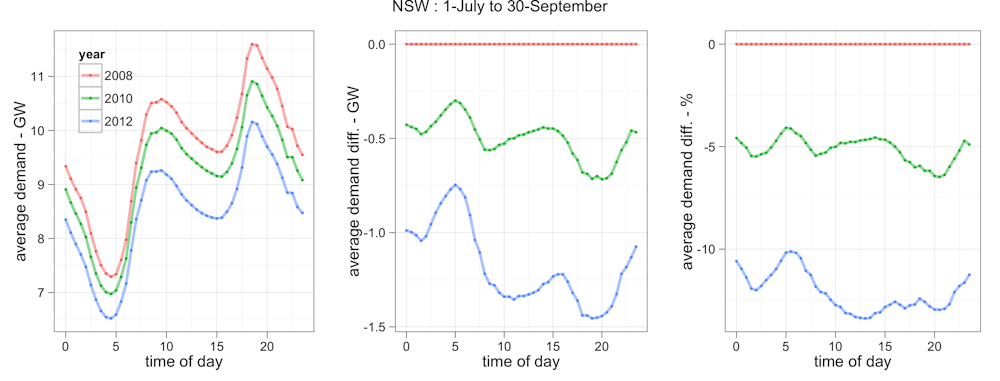
As discussed in my last post, domestic solar PV is clearly a big driver in reducing market demand in South Australia and Queensland. In those states demand outside daylight hours has not changed significantly since 2008, whereas midday demand is down almost 10%.
In NSW and Victoria the story is different. In both, winter demand has been reduced through both day and night. So factors such as better insulation (“pink batts”), solar water heating (especially in Victoria), structural changes in industry (less manufacturing, more services) are all playing a role. The big unknown is whether pricing elasticity is finally manifesting.
Has it got anything to do with the carbon tax?
Perhaps only indirectly. Simply by raising awareness of electricity as a commodity, the carbon tax debate is highlighting the blindingly obvious. We can use much less electricity without materially impacting our quality of life. Energy efficiency measures are clearly impacting on the demand side and arguably they have only just begun. A $3 billion question for industry is just how much slack is left in the efficiency equation.
My guess is we could easily reduce demand another 15% or so without any material impact on our quality of life or inconvenience. If so, that would take demand back to the levels not seen since the mid 90’s and leave us with an excess capacity on the generation side of around 4 gigawatts. Throw in the additional 3 gigawatts of new renewable genaration mandated under the RET, and suddenly we don’t need the generation equivalent of the entire Latrobe Valley, for example, where the current capacity is about 6.5 gigawatts.
Perhaps it’s understandable why the incumbent industry is beginning to squeal!