
“The UN’s climate change chief, Rajendra Pachauri, has acknowledged a 17-year pause in global temperature rises, confirmed recently by Britain’s Met Office, but said it would need to last ‘30 to 40 years at least’ to break the long-term global warming trend.” - The Australian, Feb 22 2013
Since the onset of the industrial age (from 1750 AD) Earth’s atmosphere, surface and ocean temperatures have warmed. This is mainly due to the rise in greenhouse gases (CO2, CH4, N2O, O3, halocarbons, stratospheric water vapour from CH4) by a total of +3.06 Watt/m2. Other drivers include black carbon (+0.1 Watt/m2) and solar irradiance – the latter during the first half of the 20th century (+0.12 Watt/m2).
Warming was in part mitigated by emitted sulphur aerosols (direct effects -0.5 Watt/m2; cloud albedo effects -0.7 Watt/m2) and by land clearing (-0.2 Watt/m2).
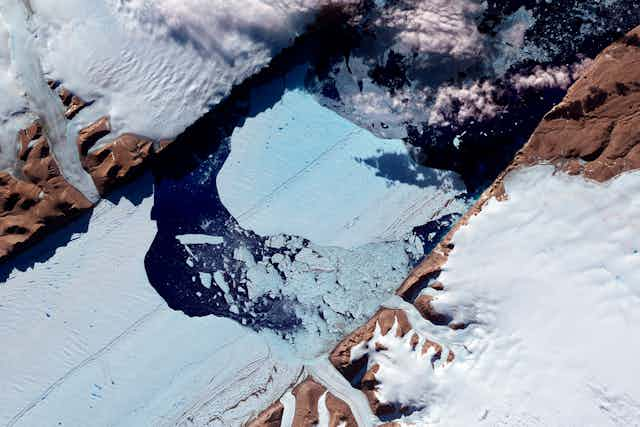
Cyclic, regional and transient climate effects are related to the ENSO cycle, water vapour (whose concentration depends on air temperature) and volcanic events. The fastest warming occurs in the polar regions: this is where there is the biggest albedo (or reflectiveness) contrast between ice and water, and where little or no water vapour exists in the atmosphere.
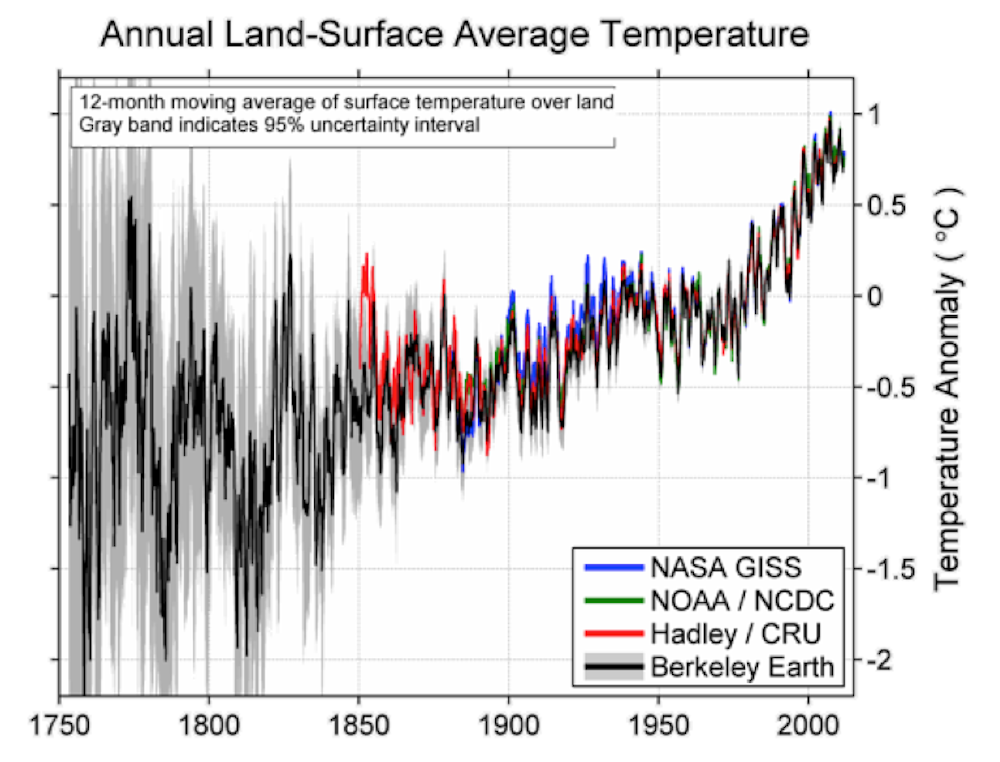
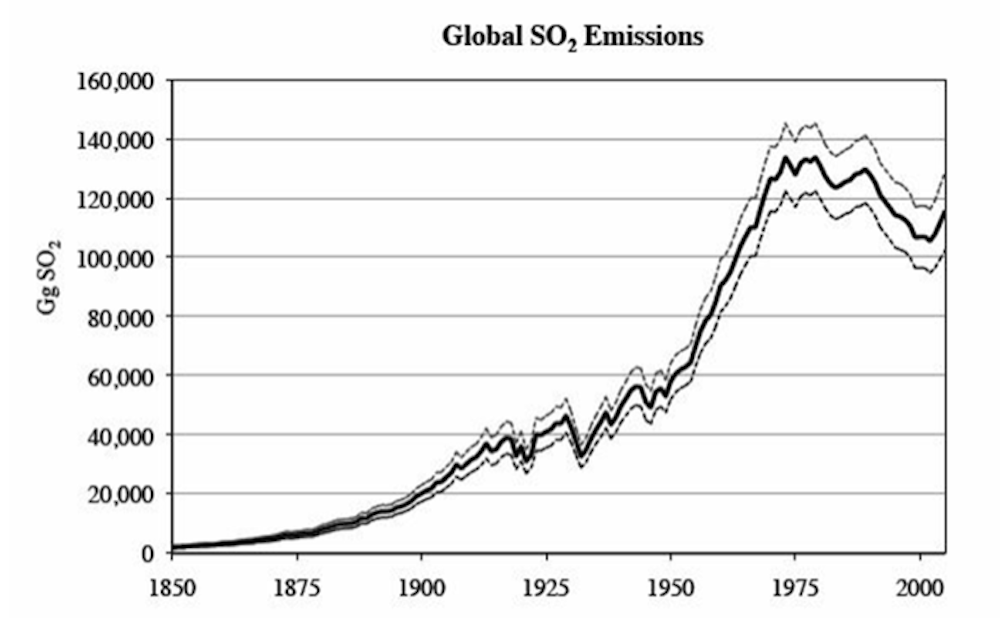
The consequent warming trend, as measured by NASA, NOAA and Hadley-Met and analysed by Berkeley (see Figure 1), indicates a rise in average land temperature by about +1.5°C over the past 250 years, and about +0.9°C in the past 50 years. A sharp rise in temperatures from about 1975-1976 was related to both an accelerated rise in CO2 and a decrease in emission of SO2 from coal and oil due to clean air policies (see Figure 2). Cleaner air decreases the reflectiveness of the atmosphere, thus driving further warming.
Following a sharp El Niño peak in 1998, since about 2000 a slowing down of the mean rate of global warming was related to a sharp increase in SO2 emission from coal mainly in China (see Figure 2), strong La Niña events and a low in the 11 years sun-spot cycle.
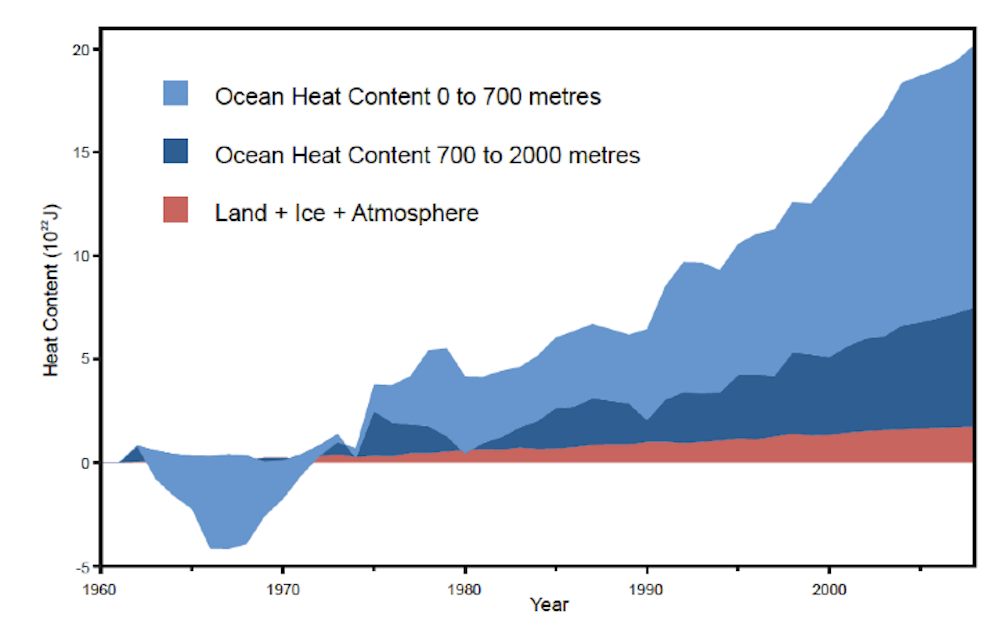
As some 90% of the global heat rise is trapped in the oceans (since 1950, more than 20x1022 joules), the ocean heat level reflects global warming more accurately than land and atmosphere warming. The heat content of the ocean has risen since about 2000 by about 4x10²² joules.
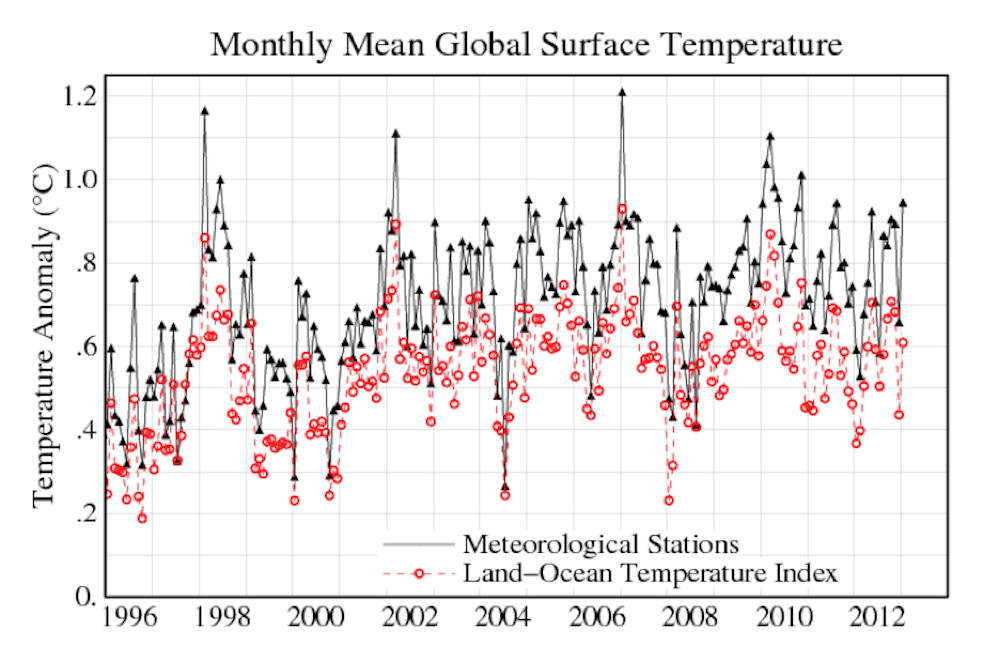
The rise in land and atmosphere temperatures since about 1996 reflects a combination of greenhouse radiative forcing from 360 to 395ppm CO2 at rates of up to 2.54ppm/year (unprecedented since 55 million years ago), the ENSO cycle and 11-years sunspot cycle. Peak temperatures at around 2006 exceed any measured in the instrumental record.
To summarise, claims that warming has paused over the last 16 years (1997-2012) take no account of ocean heating.
At the root of the issue is the non-acceptance by some of the reality of the greenhouse effect, known since the 19th century and consistent with the basic laws of greenhouse gas radiative forcing and black body radiation.