
In my previous article I reported on the findings from the Global Innovation Index (GII) for 2012. They put Australia in 23rd place overall, well outside the Top-10. This top ranked group comprised (in order of ranking) Switzerland, Sweden, Singapore, Finland, the United Kingdom, the Netherlands, Denmark, Hong Kong, Ireland and the United States.
The performance ranking measures a combination of inputs and outputs. In broad terms they provide a snapshot of the overall health of a country’s national innovation system. How well a country is ranking is important given that economies seem to evolve from low-cost factor driven ones, through efficiency-driven and onto innovation-driven systems.
For a country that cannot compete on low costs of production, the only long term salvation is to build an innovation-driven economy. This type of economy is primarily based on value adding through the commercial application of intellectual property. Industries are mostly knowledge intensive with high levels of R&D investment.
Australia is clearly unable to compete on lower costs of production and has succeeded largely due to its internationally competitive mining and energy sector. However, if the resources boom ends, as some are now predicting, what opportunities would be left to maintain an internationally competitive economy?
So if we are going to try win a better placing in the Innovation Olympics where should we start to focus our attention?
To help address this question I have compared Australia’s performance against the top ranked nations plus the United States (which ranked 10th). America’s inclusion is due to the importance of the USA as an economy and its relationship with Australia. As shown in the figure below Australia’s overall performance in terms of its innovation inputs and outputs is well below that of these other countries.

Education is the foundation
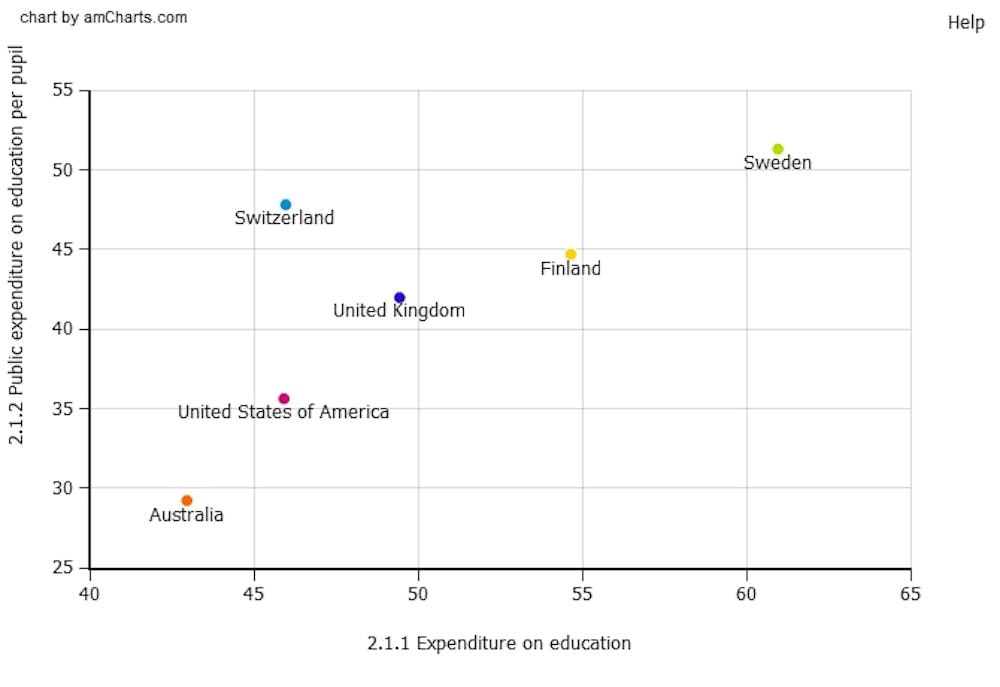
Of all the inputs needed to build a globally competitive innovation-driven economy education is amongst the most important. Sadly Australia ranks rather poorly against the top ranked nations. This is illustrated in the figure below, which shows the overall expenditure on education by the public expenditure on education per student. It can be seen that Australia performs relatively poorly on these two measures while Sweden is the best performing nation. Finland also performs quite well and Switzerland does well in terms of expenditure per student.
The recent debate over the Gonski Report into funding for Australia’s schools highlights the underlying causes of the problem. David Gonski’s findings indicated that the performance of Australia’s school students has declined at all levels over the past decade. In 2000 Australia was outperformed in reading and scientific literacy by only one country, and by only two other nations in terms of mathematics. However, by 2009 we were surpassed by 6 nations in reading and science, and 12 nations in maths.
Gonski also pointed to the insidious widening gap between the top and bottom students. There was a clear link between educational performance and low socioeconomic status. Students of indigenous ethnic background were likely to be amongst the lower performing cohort due to low socioeconomic status and language issues. The report recommended additional funding worth around $5 billion per annum across all school sectors, with at least one third to come from the federal government.
The Gonski report was well received by the federal government and most commentators have agreed with its findings and recommendations. Despite this there have been few concrete commitments by either the federal government or the opposition to implementing any of the recommendations. Instead the report has been converted into something of a political battlefield.
This is not helpful.
Building innovation clusters
Another important area within the development of a national innovation system (NIS) is the ability to build industry clusters and link industry more closely with universities and other publicly funded research centres. In earlier articles I have sought to explain the background to this discussing the importance of R&D investment the NIS, and also overviewing how South Korea built its NIS.
Clustering becomes important due to the ability to generate concentrations of businesses within specific industry sectors. This allows for the creation of a critical mass of activity with the potential to generate valuable spill-over effects. These can include enhanced knowledge exchange, increased innovation from rivalry, the attraction of skilled labour and managerial teams, and the fostering of entrepreneurs to lead new business opportunities.
Universities play a potentially important role in these clusters by training up new graduates, and also undertaking research that may result in technology transfer out to industry partners. This linkage between basic and applied research leading to tech transfer and commercialisation is a fundamental plank in the design of many of the world’s most dynamic innovation-driven economies.
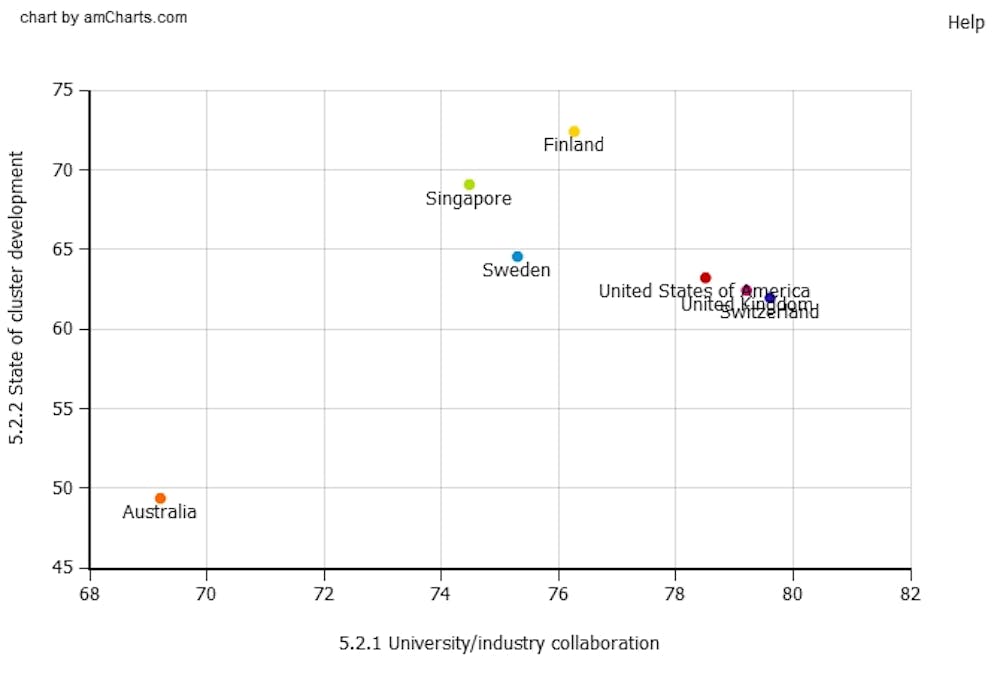
Sadly, as with our performance in education, Australia ranks poorly in this area. The following diagram shows the correlation of the state of cluster development and the level of university to industry collaboration. It can be seen that Australia is significantly behind the leading innovator nations in this regard.
We don’t have a Gonski report into this area but the recently released report from the non-government members of the Prime Minister’s Manufacturing Task Force does provide a useful proxy. This report recommended that a committee be formed to examine how the Australian university sector and various other publicly funded research organisations such as the CSIRO undertake applied innovation and technology transfer.
There are also issues associated with the way in which applied research and industry collaboration are rewarded within the Australian university sector. The decision by the Australian Research Council (ARC) to reduce the number of Linkage Grant rounds from two to only one per year is a retrograde step in terms of trying to encourage greater university-industry collaboration.
As other research undertaken by the OECD has shown, business to business collaboration is relatively good amongst small to medium enterprises (SMEs) in Australia (ranked 5th in the OECD), but quite poor amongst large firms (ranked 23rd in the OECD). This is an area for concern and one that requires additional attention and policy action.
R&D inputs and high tech outputs
As a final review of Australia’s performance as a competitive innovation-driven economy we can look at the relationship between gross expenditure on R&D (GERD) and three key outputs: patent applications, royalty and licence fee receipts and high tech exports. These are illustrated in the following diagrams.
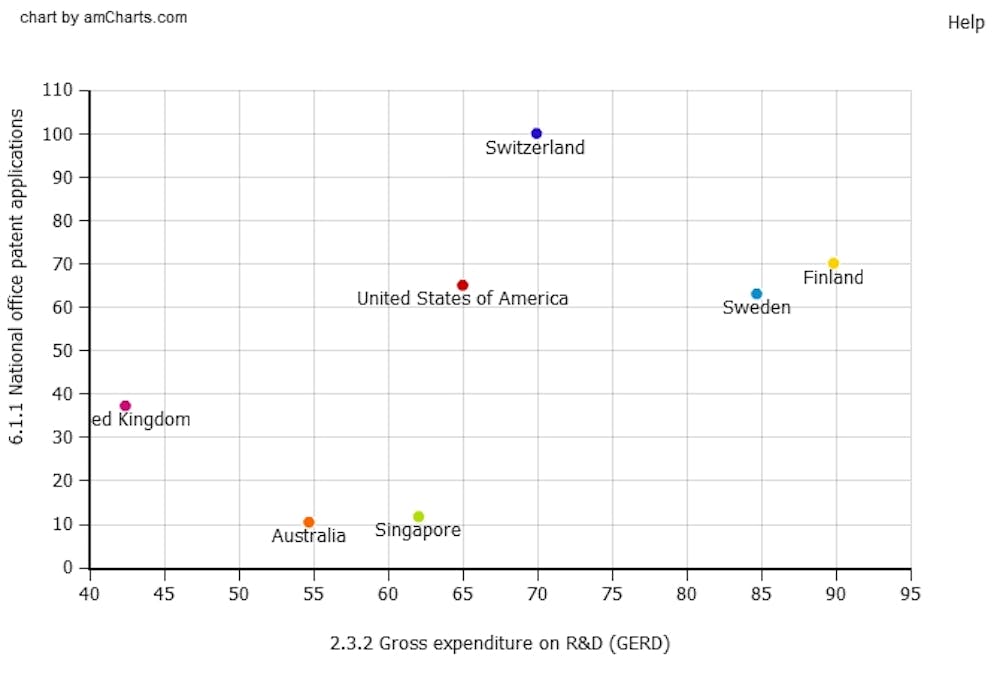
First, let us look at the relationship between GERD and national patent office applications. As can be seen from the figure below, Australia is close to Singapore’s performance in this and both nations are well behind Switzerland, Finland, Sweden and the United States. This should be a concern. Not only does Australia spend less than all these benchmark countries with the exception of the UK, but it seems to generate relatively few patents.
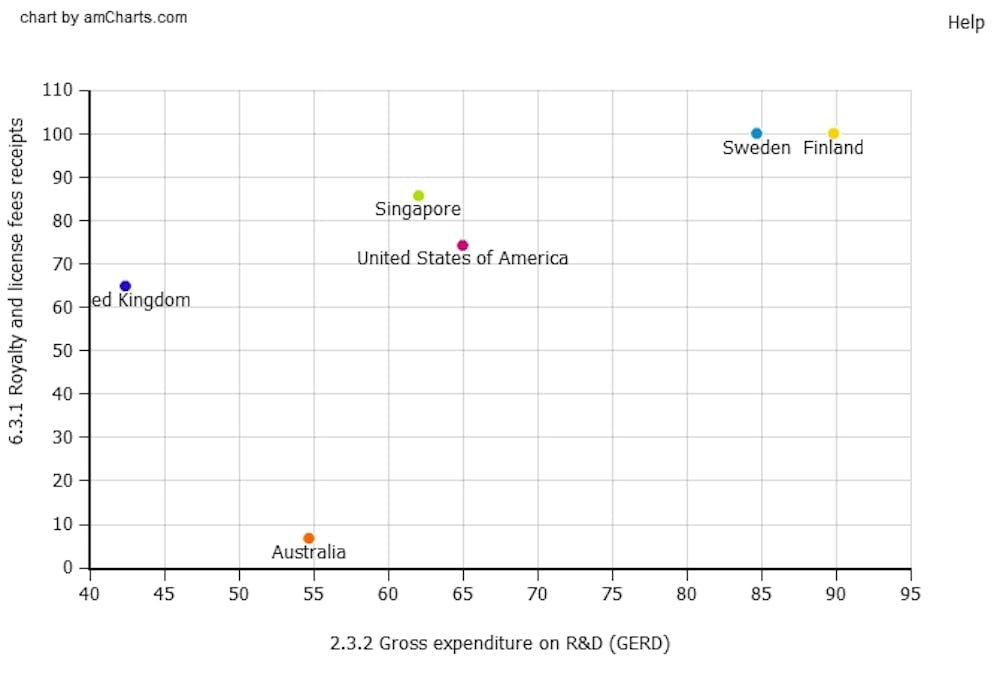
The second relationship worth attention is that of GERD and the income received from royalties and licence fees. While not all R&D investment is likely to result in commercialisation outcomes that can generate license fees, the use of licensing has now become a major opportunity for the generation of revenues. It can be seen from the figure below that Australia has a relatively poor performance in relation to our ability to secure royalty and licence fees. This is particularly when we are compared with Finland and Sweden, and also Singapore and the United States.
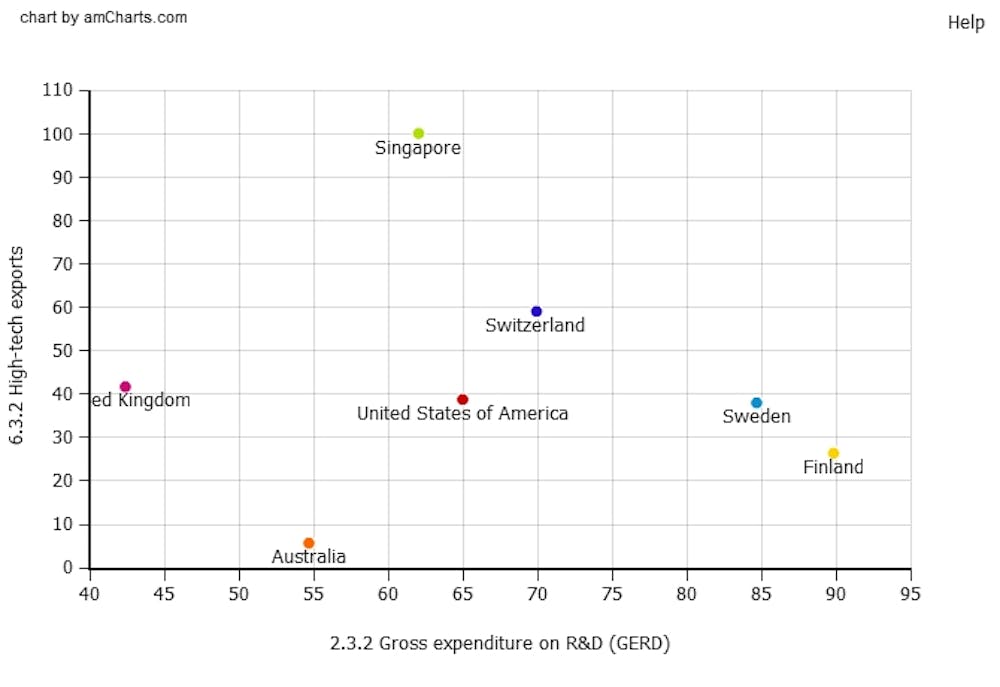
The third relationship is that of GERD and the percentage of high technology exports less re-exports. As shown in the following diagram Australia exports relatively few high-tech products in comparison to the other six countries. Singapore does particularly well in terms of the percentage of high-tech exports less any re-exports.
So what should be done?
There are no easy solutions for enhancing Australia’s innovation profile and getting us into the Top 5, or even the Top 10 of the GII ranking. It will require a national consensus by all sides of politics that this is an important national aspiration. There will need to be significantly greater investment in education, R&D and the willingness to innovate and collaborate for the greater national good.
I use the analogy with the Olympics deliberately because it is clear that when Australia is engaged in these international sporting events all sides of politics, the mainstream media and the majority of Australians are united in their common desire to see this nation win. Yet we are complacent in a world in which our longer term economic prosperity will depend on how well we compete in the global Innovation Olympics.
This should be something that attracts more attention than it currently does.