
In the electricity game, the “poles and wires” have become the big issue. Even the Prime Minister has starting pointing the finger at excessive investment in the electrical power grid.
So what is it with the grid that has suddenly got the Prime Minister, and just about everyone else in the electricity game, so fired up?
The background to the debate is provided by the rising cost of retail electricity. Retail electricity prices have been rising much faster than inflation over the past few years.
With the carbon tax now in place, the cost of electricity is a very hot political issue, so reducing pressures on electricity price rises is a key objective of the government’s offensive. In emphasizing the “pole and wires” the Prime Minister is pointing the finger at the grid as a key driver of recent price rises. It is the way we distribute electricity, rather than generate it, that dominates retail prices, so the argument goes.
In particular, the Prime Minister and others have begun to highlight policies that have encouraged over-investment in, or gold-plating, the electricity grid. With utilities receiving a guaranteed rate of return, grid investment has been something of a “no-brainer” for them, even if demand hasn’t fully justified it.
And now electricity demand is changing the way we utilize the grid in quite unprecedented ways.
To get some sense of the challenges, we need to look at those changes in the context of past forward projections that have guided recent and current investments. From 2000 to 2006 average demand on the National Electricity Market - or NEM - grew at about 2.2% annually. Growth varied by state, lower than average in the south (1.7% in Victoria) and higher in the north (3.8 % in Queensland).
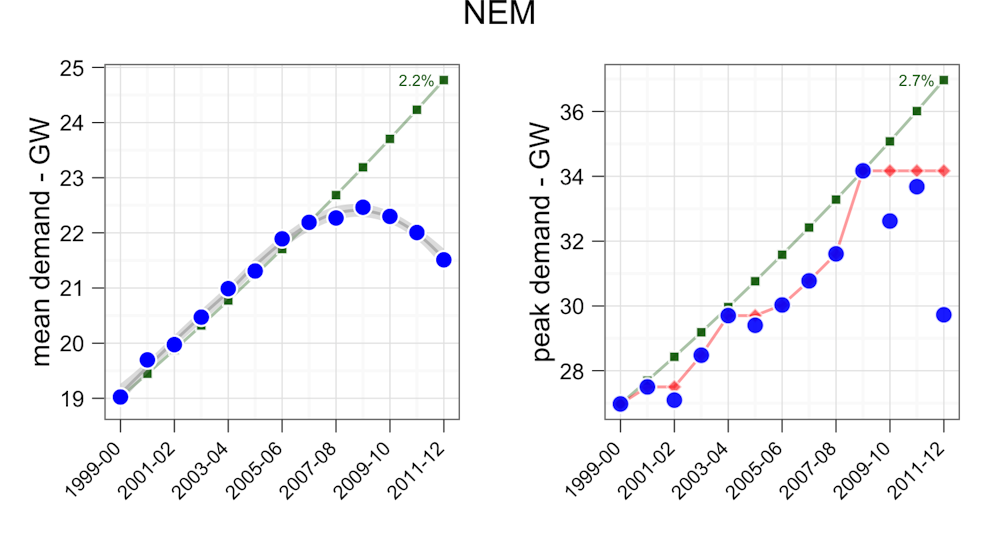
That all changed about 2007, when the rate of growth in demand started to decline. By 2009, actual demand started to decline. In real terms, demand for electricity has fallen across the NEM by 900 megawatts or 4%. Compared to forward projections of 5 years ago, demand is down 3 gigawatts, or about 14%.
That demand reduction necessarily means our grid is now distributing far less electrical power than had been planned for as recently as 2009. It necessarily means our grid is being utilized less productively. To understand by just how much it is necessary to look at the expectations for peak demand growth.
Compared with average demand, peak demand has grown faster, more erratically and for longer. Across the NEM peak demand growth averaged about 2.7% between 2000 and 2009 when it culminated at 34 gigawatts. There was considerable variability by jurisdiction. In Victoria peak demand grew at a rate of 3.4% or about twice the average demand. In Queensland, peak demand growth was higher at 4.4%, but only 15% greater than average demand growth.
Peak demand is quite sensitive to seasonal weather effects, so there is considerably more variability from year to year when compared to average demand. Nevertheless, the ratio of average to peak demand remained relatively constant at about 70-73% through the period 2000-2007. Notably, the ratio was significantly lower in the south (50-55% in South Australia) and higher in the north (73-75% in Queensland).
Like average demand, annual peak demand has also fallen in the last few years. In 2011-12, peak demand across the NEM was down over 10% on the record 34 gigawatt high of 2008-09. The lower peak demand in the last few years can be attributed in part to the La Nina weather cycle, which has resulted in relatively cool and wet summers, with few extended heat waves.
Since the grid must be scaled to carry peak power loads, the ratio of average demand to peak demand provides one metric of how effectively we are using the grid. The higher the ratio, the higher the utilization rate.
In reality, the grid utilization rate depends the capacity of the grid, which varies in both space and time. The grid must be sized to carry the highest past peak, and each year it is extended to meet any anticipated growth in peak.
Wary of the risk of blackouts, governments have provided conducive conditions for network operators to make the necessary investments in grid capacity. That worked well for governments when demand was growing, but is now proving to be something of a nightmare.
Who knows just how many air conditioners there are out there in suburbia that have never been turned on? And that’s the rub for government and utilities. When our weather cycle breaks back into the El Nino conditions and summer temperatures start to soar, who knows what demand we will likely expect?
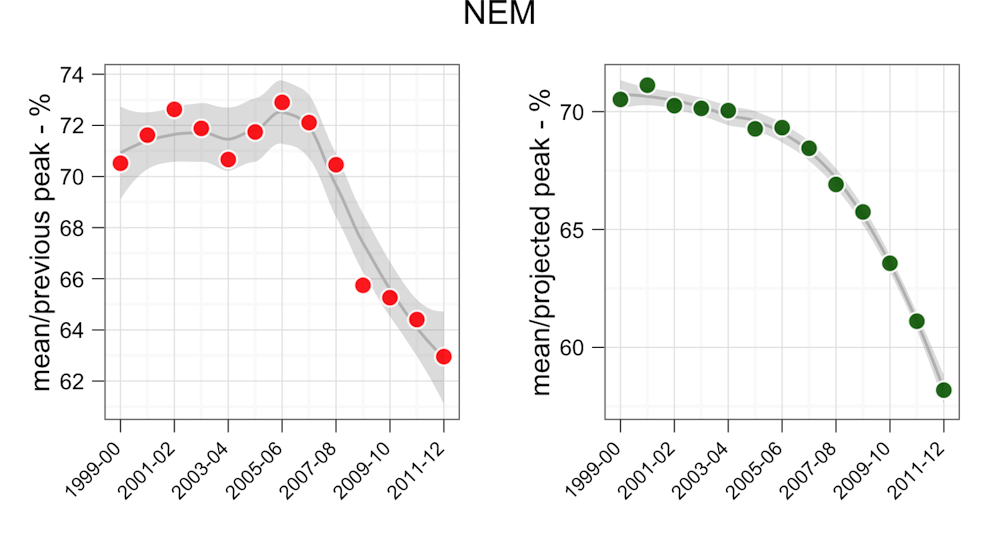
So how efficiently are we using our grid, and how has it changed?
The ratio of average demand in a given year to the past peak demand gives an upper limit on how effectively we are using the grid. That ratio has fallen by around 9% over the five years since 2006-07.
The ratio of average demand to projected peak growth gives a measure that accounts for likely grid investment in recent years. That ratio has fallen even faster, by a total of about 12% since 2006-07, and by about 2.5% in the last financial year.
Comparing average to expected peak demand provides only one relatively crude measure of just how we are utilizing our grid. A more comprehensive view is provided by looking into the details. For example, by asking how much of the time are we using the grid above a certain proportion of its capacity?
In Victoria, where we have seen projected peak demand rise at almost twice average demand, such an analysis leads to some worrying insights. Back in 1999-00 the grid was utilized for around 210 days at the 65% capacity level and above. In the last financial year, it was only being utilized at that level of projected capacity for about 6 days. That is a fall in utilization at that level of 97%. At the 75% capacity level, utilization of the Victorian grid has fallen over the same period from almost 71 days to about ¼ of a day.
It is important to note these numbers are based on an estimated projected growth scenario, and will necessarily remain just estimates until the grid is next pushed to its limits. That is not likely until the next record breaking summer heat wave occurs, and in the face of falling average demand may not occur for many years to come.
With the caveat that we don’t have an absolute gold standard measure of the present capacity, these estimates do however confirm we are witnessing quite staggering reductions in the way we utilize the grid. And we are necessarily paying an increasing price to maintain the capacity of the grid in the expectation of what are very rare and increasingly uncertain peak demand events.
With all the trends heading in the wrong way, further falls in demand will necessarily reduce our utilization of the grid. So too will any further investment in grid capacity in the expectation of further peak demand growth.
It is fair to say this fall in average demand has blind-sided the power utilities, governments and market operators alike. None anticipated it, and all have taken a long time to acknowledge it, given it is now into its fourth or fifth year.
There is little to be done to turn around absolute demand, but various measures are available to curb peak demand growth. They include time-of-use pricing and distributed generation within the grid. More efficient standards on air conditioning will be essential. We will need to recognise that the cost of measures that push up peak loads, such as air conditioning, necessitate a grid upgrade. The cost of that upgrade is paid by all electricity consumers, and not just those who buy the air conditioners.
Perhaps there is hope in the reinvention of the power utilities themselves. In the face of falling demand, the utilities will need to realign their business models around energy services, rather than just electrical power. In an energy service model, managing the flow of electricity across the poles and wires will be crucial to enhancing profit margins. Gold-plating will be out of the question.
Such measures will provide the tools necessary to get some productivity back into the grid. If we don’t, then the problems in the grid will only get worse.