
Dr Rajendra Pachauri, head of the IPCC, has reportedly acknowledged to Graham Lloyd of The Australian, that there is a “17-year pause in global temperature rises”, a fact that apparently has been suppressed in Australia. Dr Pauchauri endorses debate, saying that people had a right to question the science, whatever their motivations.
But according to Lloyd, Pachauri’s views contrast with arguments in Australia that views outside the orthodox position of approved climate scientists should be left unreported.
Am I an “approved” climate scientist? because I don’t hold that view, nor do I know any who does. What we would like, though, is for science to be reported as science and for opinion to be reported as opinion. And for all reporting to be accurate.
Lloyd makes this claim: unlike in Britain, there has been little publicity in Australia given to recent acknowledgement by peak climate-science bodies in Britain and the US of what has been a 17-year pause in global warming. Britain’s Met Office has revised down its forecast for a global temperature rise, predicting no further increase to 2017, which would extend the pause to 21 years.
This is the Met Office’s latest five-year forecast shown below. Skeptical Science reports the Met Office saying: the latest decadal prediction suggests that global temperatures over the next five years are likely to be a little lower than predicted from the previous prediction issued in December 2011. We’re in the midst of a period of La Niñas, which have a slight cooling effect, as do rising sulphate emissions in Asia. But look at the blue line – do my eyes deceive me? Is it level with the previous black line? It’s warmer? Perhaps Lloyd’s computer has a tilt to the right that makes increases look level.
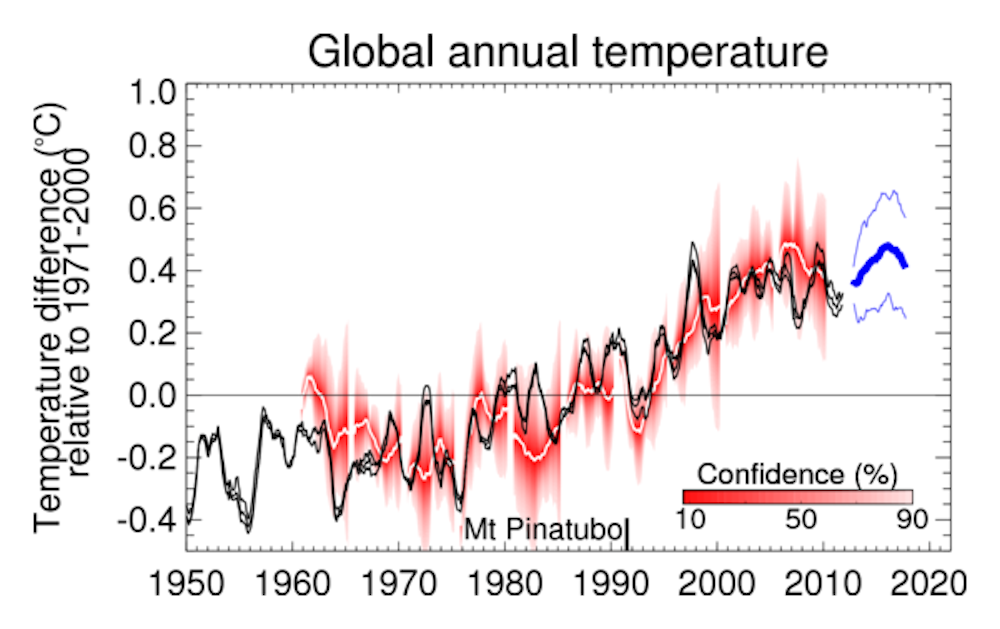
The Met Office predicts record global mean temperature over the next five years – now that’s news.
News Corporation sells roughly 70% of the newspapers in metropolitan Australia, and its readers are subject to this kind of fudging on a regular basis. It’s no wonder some “approved” scientists are frustrated.
But that’s not the only thing that frustrates me. It is also time to challenge what Lloyd calls the orthodox position of climate science.
Climatology needs to stop hiding behind long-term trends and explain what is in plain sight, and why variations in the rate of warming might be important. I’m working with colleagues at the moment on a National Climate Change Adaptation Research Facility project called Valuing Adaptation to Rapid Change and we’re looking at the economics of rapid change. Non-linear behaviour in climate driving extreme events has the potential to really hurt us.
The first thing to bear in mind is that a trend line is a model. A warming trend is not a theory of how climate changes. If a complex, non-linear system fails to follow a trend, look at the model to see whether it represents the theory sufficiently well.
In a nutshell, the theory says greenhouse gases act like a blanket, trapping heat near the surface. This creates a radiation imbalance at the top of the atmosphere. The earth system warms to return this balance by increasing the heat escaping from the top of the atmosphere so that energy out equals energy in. This is a slow process, taking centuries, because the ocean has to warm sufficiently to support a hotter atmosphere. The scientific confidence in this aspect of climatology is extremely high. A simple trend line is sufficient to measure this process.
But on decadal time scales, the trend-line model fails. Most of the heat trapped in the earth system goes into the oceans. The top 700m of ocean increased in heat content from 3 x 10²² Joules in 1997 to 10 x 1022 Joules in 2010, in a highly non-linear manner, due to mixing rates between the surface and deep ocean. The atmosphere holds as much heat as the top 3m of ocean, about 0.4% of the heat content above. Why on earth then, with highly non-linear processes in the ocean, would we expect a gradual warming trend in the atmosphere?
A paper I published last year shows that most of Australia’s warming occurred in two episodes, one in the late 1960s to early 1970s, when south west WA rainfall also decreased, and the other in 1997-98. The other finding was that most of this warming was anthropogenic. On decadal timescales, step and trend is a much better model for explaining warming than simple trends.
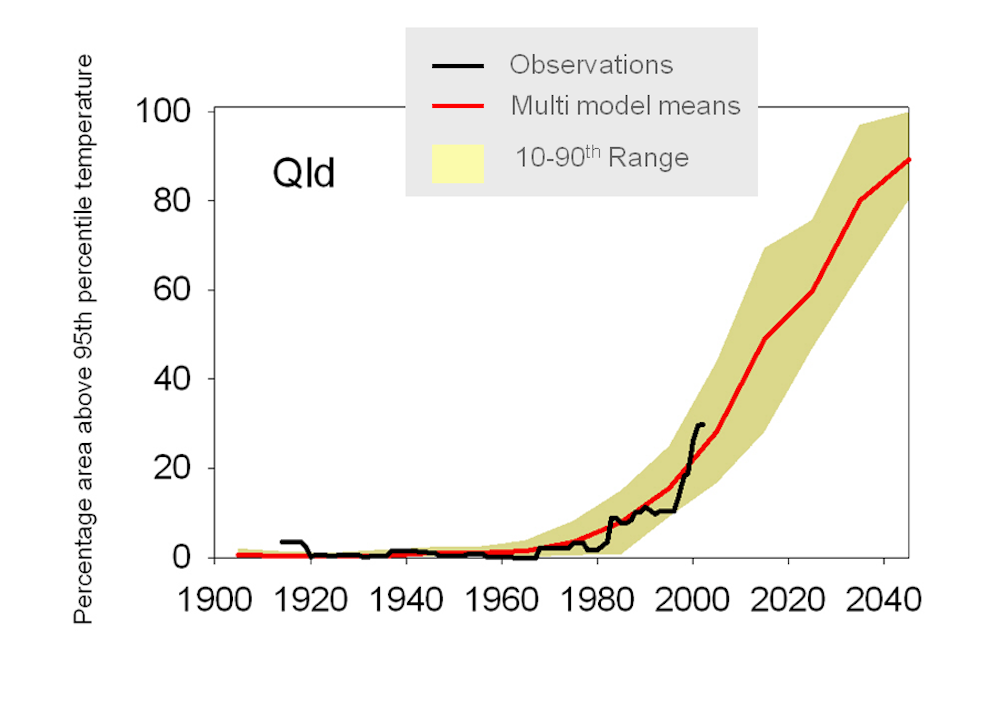
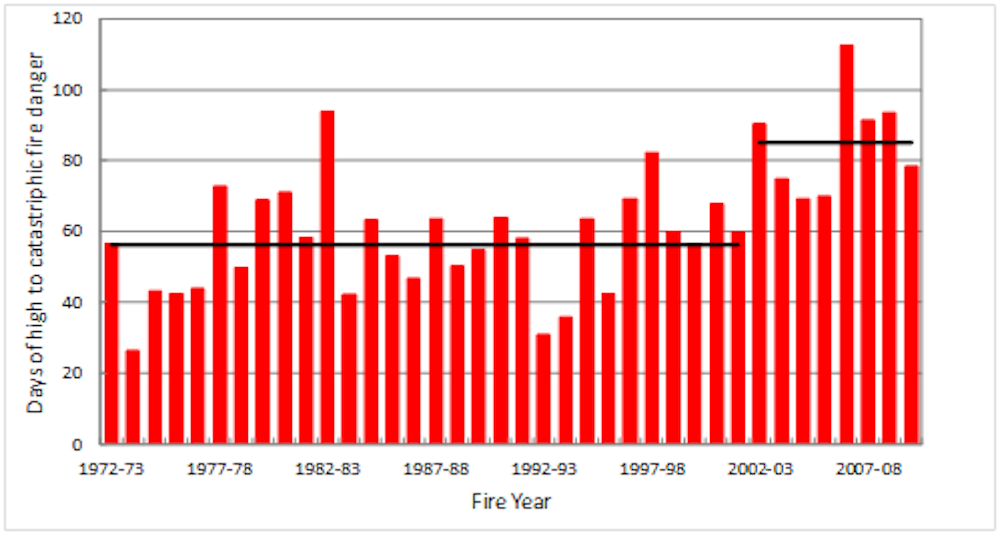
To me, the graph above makes perfect sense: mild trends separated by an instantaneous rise of about 0.3°C. By ignoring non-linearity and projecting future climate change as simple trends, orthodox science is doing us a great disservice. We have not yet woken up to the recent non-linear increases in heatwaves and fire danger in Australia let alone planning for more such changes in the future. The same goes for floods.
It’s time to stop defending orthodox science by hiding behind simple trends and come to grips with the fundamental non-linearity of climate change. That’s the risk we need to mitigate, adapting to changes that can’t be avoided.