

One certainty about economic forecasts is that, almost certainly, they will prove to be incorrect. The best forecasters can hope for is not to make systematic errors – to get it right on average – and to ensure that forecasting errors are relatively small.
It is political folly to hope for more. This is a message that current and aspiring Treasurers should take from last week’s release of the Commonwealth Treasury’s Forecasting Review. A second message, but not a recommendation made by the Review, is that pain could be avoided if politicians were more open about the uncertainty involved in forecasts of budget outcomes and the uncertain consequences of new policies more generally.
As presently structured, annual budget statements are coy about forecast uncertainty. Take the 2012-13 statements for example. In Mr Swan’s budget speech, he rehearsed the ways in which past forecasting errors resulted in lower-than-expected tax revenues, but then went on to list the “responsible decisions which return the Budget to a $1.5 billion surplus in 2012‑13”.
Clearly, the Treasurer’s remarks revealed a disconnect between past mistakes and future certainty.
To be fair, the budget documents do make explicit references to forecast errors and uncertainty. But they are buried away in Statement No. 5 and an appendix to Statement No.3.
The appendix discussion, for instance, is cast in terms of scenarios whose impact on the fiscal outlook is “purely illustrative”.
For example, one scenario looks at the effect of a fall in non-rural commodity export prices sufficient to cut the terms of trade by 4% which, in turn, leads to a fall of 1% in nominal GDP. Under a number of assumptions, this results in deterioration in the budget of $3.4 billion in the first year, and $7.1b in the second year.
Not many readers would get this far, but most of those who do would know that the terms of trade are volatile and difficult to forecast. So, at first glance, this seems to be helpful.
However, the variable of interest is not the terms of trade but a component of it: non-rural commodity export prices. In plain English, this refers to minerals, oil, and gas, which make up about three quarters of exports of goods and services. So the relevant fall in prices is a bit over 5%.
So far, so good. But to make the scenario useful in assessing risk to budget outcomes, the reader needs to know the likelihood of a fall (or rise) of this magnitude. In other words, Treasury would need to provide its assessment of risks for forecasts of prices of minerals, oil, and gas.
Which brings us back to the Forecasting Review. The Review gives the Treasury a pass mark in the sense that its forecasting performance is as good as (or better than) performances by comparable agencies. It also makes a number of recommendations as to how its performance might be improved, especially in relation to forecasting components of tax revenue.
But forecast errors can never be eliminated, so it is important to clearly communicate forecast risks to policymakers and the public. In this respect, the Review falls short. Its recommendation is limited to including, in the annual budget documents, an explanation of the sources of last year’s forecasting error for real and nominal GDP. This is a useful supplement to accountability, but does little to inform readers of Treasury’s estimates of likely forecast errors over the coming year, let alone four-year horizon included in many budget tables.
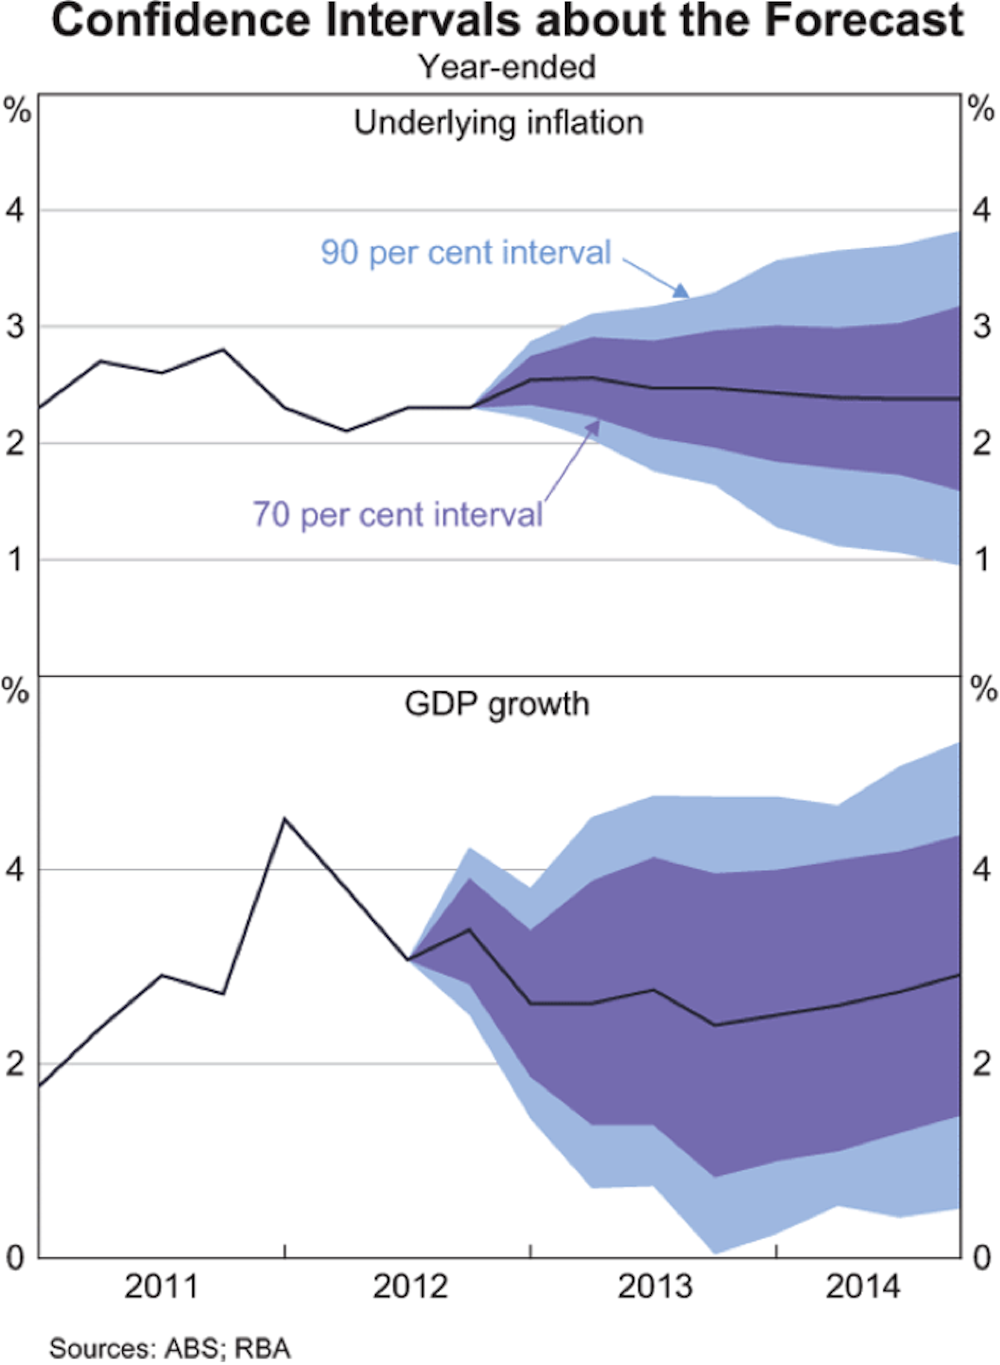
The Reserve Bank has recently taken the lead in this regard. In its February Statement on Monetary Policy, it provided an analysis of likely forecasting errors, assuming that these errors are similar to those made in the past. The relevant chart is reproduced below. Assuming the pattern of forecast errors remains the same, the top panel shows that there is a 70% chance that underlying inflation for the calendar year 2014 will fall between 1.6% and 3.2%.
The Bank of England goes further. Its starting point is the same as for the Reserve Bank – an analysis of past forecast errors. But it then applies its judgement to generate an assessment of current forecast uncertainty. Their most recent ‘fan chart’ for forecast GDP growth is shown below. The darker is the green shading, the more likely the forecast outcome.

The fan chart usefully highlights a second, sometimes ignored issue in forecasting. Even the present situation is not known with certainty because statistical agencies often make substantial revisions to data series as sample data are supplemented by more complete information. In the fan chart, the distribution of estimates of past growth reflects the likelihood of data revisions.
The public could be better informed — and could be spared many of the cheap shots that characterise current political debate — if Treasury went beyond the recommendations of the Review and offered a more informative discussion on forecast uncertainty. They should follow the lead offered by central banks.